NOTICE OF Council
MEETING
The Meeting of
Parramatta City Council will be held in the Council Chamber, Fourth Floor, 2
Civic Place, Parramatta on Monday, 28 May 2012 at 6:45pm.
ATTACHMENTS
Parramatta – the leading city at the heart of Sydney
30 Darcy Street
Parramatta NSW 2150
PO Box 32 Parramatta
Phone 02 9806 5050 Fax 02 9806 5917 DX 8279 Parramatta
ABN 49 907 174 773 www.parracity.nsw.gov.au
“Think Before You Print”
TABLE OF CONTENTS
11.3 Amended Delivery
Program 2010/14 and 2012/13 Operational Plan, Fees and Charges 2012/13 and
Updated Strategic Asset Management Plan
Attachment 1 Draft Updated
2010/2014 Delivery Program and Draft 2012/13 Operational Plan (Distributed
under separate cover to Councillors and Senior Staff. For a copy pls contact
council support on 98065314)
Attachment 2 Draft 2012/13 Fees
and Charges (Distributed under separate cover to Councillors and Senior Staff.
For a copy pls contact council support on 98065314)
Attachment 3 Strategic Asset
Management Plan (Updated March 2012) (Distributed under separate cover to Councillors
and Senior Staff. For a copy pls contact council support on 98065314)
|
Item
11.3 - Attachment 1
|
Draft Updated 2010/2014 Delivery Program and Draft
2012/13 Operational Plan (Distributed under separate cover to Councillors
and Senior Staff. For a copy pls contact council support on 98065314)
|
17/05/2012
11:32:22 AM
Parramatta City Council
Draft Delivery Program 2010-14
Draft Operational Plan 2012-13
Delivering on the Community Vision
Parramatta Twenty25
Parramatta’s Community Strategic Plan
|
|
Lord
Mayor’s Message................................................................................................................................. 3
CEO’s Message.................................................................................................................................................. 5
About Parramatta’s 4-year Delivery Program
2010-14 and 1-year Operational Plan 2012-13..................................................................................................................................................................... 7
Parramatta Twenty25: What is it?........................................................................................................... 8
ABOUT PARRAMATTA........................................................................................................................................ 10
Council’s Delivery Program 2010-14................................................................... 11
Environment & Infrastructure............................................................................................................. 12
Community & Neighbourhoods................................................................................................................ 17
Economy & Development.......................................................................................................................... 24
Governance & Corporate....................................................................................................................... 34
Council’s Operational Plan 2012-13.................................................................... 46
Environment & Infrastructure............................................................................................................. 47
Community & Neighbourhoods................................................................................................................ 51
Economy & Development.......................................................................................................................... 55
Governance & Corporate....................................................................................................................... 60
Financial
Management Framework (Resourcing Strategy) ................................................ 63
2012-13 Budget................................................................................................................................................. 69
Income & Expenditure Estimates.......................................................................................................... 72
Rates, Fees & Charges (Schedule of Fees
& Charges included under separate cover) ................................................................................................................................................................. 83
LORD MAYOR’S MESSAGE
The Delivery Program was
created to provide the basis for Council’s spending over a four-year period, to
enable us to focus on delivering quality services to the Parramatta community
whilst allowing us to be financially sustainable and responsible. We review and
adjust the plan each year, which allows us to respond to changing circumstances
and new opportunities.
We have strived to maintain Parramatta’s high profile and
keep the needs of our city on the radar for state and federal governments when
they distribute funding for growth opportunities. We regularly meet and
contact members of the State Government to ensure they consider Parramatta as the smart choice for relocation of government departments and recognise that
investment in transport infrastructure in Western Sydney will answer many of
the greater city’s employment and commuter problems.
One of our primary goals in the coming year will be to
conduct a feasibility study for a light rail system from the Hills, into Parramatta and beyond to Bankstown, as the first section of what could be the solution to
many of our transport woes. We will, of course continue to push for
construction of the Epping to Parramatta rail link.
Parramatta has developed as a city of festivals. Our own
Sydney Festival Parramatta Program, not withstanding the rain, proved to be an
amazing success. The Parramasala Festival of South Asian Arts, Loy Krathong and
Winterlight combined to create a vibrant city. Australia Day in Parramatta just cannot be topped and this year over 22,000 people lined the river to
celebrate New Years Eve.
Of primary importance is our Operational Plan, which
delivers 41 core services to the community each year. In 2012/13 Council
will spend $146 million on Operating projects and services (excluding
depreciation) and $54.6 million on specific capital projects.
Breaking this down, our
Operating Expenditure includes:
· Roads, footpaths and
drainage - $12.8 million
· Waste and Sustainability
Programs - $19.0 million
· Parks and Open Space - $10.9
million
· Children and Family Services
- $4.0 million
· Community, Youth and senior
services - $4.2 million
· Library services - $6.6
million
· Property development - $4.2
million
· Development & traffic
services - $7.0 million
· Parking facilities - $4.5
million
· Arts and culture - $5.5
million
· Tourism and events - $5.3
million
· Recreation facilities and
programs - $6.1 million
· Corporate management and
Councillor services - $5.6 million
· Trades and fleet management
- $3.1 million
· Human resources management -
$4.1 million
· Natural areas management -
$1.7 million
In 2012/13 Council proposes to
spend about $54.6 million on capital projects. This includes a significant
allocation for projects to position Parramatta as the central city in the heart
of Greater Sydney.
Council has allocated $0.875
million for project management of Civic Place, which remains a high priority for
Council. Our aim is to provide a new civic space, administration centre for
Council and much-needed new commercial space.
We continue to focus on our core
business of maintaining and repairing roads. We have budgeted $5.1 million for
this, along with $1.2 million for the continuation of the Pedestrian Access and
Mobility Program (PAMP).
Maintaining our parks and
recreation facilities is also important – $17 million has been allocated for
their upgrade and maintenance.
The Neighbourhood Improvement
Program will continue, with a budget of $1.49 million.
Council is well on its way to
making Parramatta a better place to live, work and play.
Lord Mayor of Parramatta
Councillor Lorraine Wearne
CHIEF EXECUTIVE OFFICER’S MESSAGE
It
has been another busy year for Parramatta City Council and the City, one that
has seen major developments such as the Eclipse tower rise to transform the CBD
skyline, and one that has seen Parramatta positioned front and centre of
discussions about the future of Greater Sydney.
As
the central city of Sydney, nowhere is better positioned than Parramatta to
provide solutions to the region’s future employment and transport issues. We
know the future growth of Sydney will be in the west and Parramatta is rising
to the challenge to cater for this increased demand in services.
Parramatta
City Council has taken a lead agency role in lobbying the government to
consider various options to improve transport infrastructure in the west. We
have called for more relocation of government services to Parramatta. And we
have worked with major partners such as Destination NSW and Sydney Festival to
make Parramatta a new festival City, known for its vibrant, diverse calendar of
events.
Parramatta is open for business and ready to be a great capital
to live, work, play, invest and learn.
Council
has prepared for this. When we created our four-year Delivery Program we
undertook a major review of services to make sure we were delivering the right
services in a financially sustainable way.
Now
we are more than half way though the delivery of this program and we are
starting to see the benefits of these efficiencies.
As
we enter the last half of this planning cycle, we are looking even further
ahead to the future to make sure we are adequately planning for the future
needs of our City.
The
Delivery Program and Operation Plan help us meet our long-term goals, which are
outlined in our Community Strategic Plan, Parramatta Twenty25.
In
the coming year, we are thoroughly reviewing this plan to make sure we are
meeting the challenges and opportunities that are emerging around us.
Parramatta 2036 will
be prepared in partnership with the community and will outline where we want Parramatta to be in the future.
While
we work on this aspirational document, we will continue to roll out our current
Delivery Program, which outlines Council’s role in achieving our objectives for
the city.
Council
organises its activities and projects into four categories that we call
pillars:
· Environment and Infrastructure
· Community and Neighbourhoods
· Economy and Development
· Governance and Corporate
Environment
and Infrastructure
One
of our key objectives is helping people and places to be linked by sustainable
transport and communication networks, and this remains a key focus in the
coming year. We will create more cycleways and provide more bike facilities and
boost pedestrian safety along busy roads.
Restoring
natural areas and waterways also remains a high priority, providing safer,
healthier and attractive spaces for residents to enjoy.
Community
and Neighbourhoods
Council
strives to sustain liveable neighbourhoods that are distinctive, diverse, safe
and cohesive.
In
the coming year budget will be on developing and improving our parks and
recreation facilities, maintaining our public halls and community centres, and
continuing the operation of pools and sportsgrounds. We have improved access to
our pools by offering a free access day for pensioners and a free family pass
to our residents.
Economy
and Development
Council
is progressing the development of several key sites in the CBD, not least of
which is Civic Place, which will be reinvigorated in the coming year with the
aim of seeing it start as soon as possible. It remains one of the country’s
biggest redevelopment projects and will change the city centre for the better.
Council
has progressed the development of a new Operations Centre to replace its aging
depot sites, with work likely to start in the coming financial year.
Expressions
of interest have been sought for the development of two key sites – the current
Macquarie Street carpark site, and the Lennox St car park site, which will
transform and activate our stunning river foreshore district and provide new
opportunities for Parramatta’s growth.
We
have strived to build a reputation for Parramatta as a city of festivals and
this will continue to be a focus for the coming financial year. Last year saw
the inaugural and hugely successful 10-day Sydney Festival Parramatta program,
and this will be a regular feature of our major events calendar. We will once
again invest in Parramasala Festival of South Asian Arts, returning for its
third year, and we will create a winter wonderland in the heart of the city for
Winterlight.
Importantly,
we continue to work with external stakeholders to develop areas such as
Rydalmere and Camelia as thriving industrial precincts, and Westmead as our
world-class biomedical research precinct.
Governance
and Corporate
Council
has started to reap the benefits of its major Services Review in 2010, with
identified savings of $2.6 million made in the first year alone, on top of
previously identified improvements.
This
exercise has evolved into an on-going Continuous Improvement and Innovation
Program, which is imbedded throughout the organisation as part of our
day-to-day business.
We
aim to be an employer of choice and recently scored a very favourable 74% staff
engagement result. Our aim is to reach 80%, which would place Council in the
country’s top 200 organisations.
We
have supported staff by rolling out a new salary system and new Employee Annual
Assessment and Development Plan to engage staff and encourage innovation. We
have embedded new training opportunities through employing a new MyLearning
tool.
We
continue to drive ‘smart city’ innovations in our organisation through our
e-Parra program. Through this program we have deployed new and innovative
technology to make our business more effective and efficient.
Finance
We
have previously reported that there was an unsustainable gap between our
operating expenditure and revenue, which drove the need for our Future Pathways
strategy and the implementation of our comprehensive Services Review. I am
pleased to announce that the saving from our review and the introduction of a
modest, phased rate increased plus other cost saving measures means we are now
closing the gap and are on track to hit a break even budget by 2014/15.
It
is important to note that this has been achieved without cutting any frontline
services.
Better
still, we have used our reviews to focus on improving performance in four areas
– finance, customer service, internal processes and business – which are
already starting to show positive financial returns.
DR ROBERT LANG
CHIEF EXECUTIVE OFFICER
About Parramatta’s 4-year Delivery
Program 2010-14 and 1-year Operational Plan 2012-13
In
2010 Council adopted its first 4-year Delivery Program which outlined the
activities to be undertaken by Council from 2010 to 2014 to achieve the
delivery of Parramatta’s Community Strategic Plan – Parramatta Twenty25.
It provided the agreed way in which
Council will deliver the parts of Parramatta Twenty25 that relate to Council as
well as outlining how Council intends to encourage other businesses, government
agencies and non government organisations to deliver other parts.
The
Delivery Program is regularly reviewed and some changes have been made to
accommodate changing circumstances and emerging opportunities. There has been
no change however to the overriding direction of the Program - to deliver the
objectives of Parramatta Twenty25 in a financially sustainable manner.
Supporting this Delivery Program is a 1 year
Operational Plan. It spells out the details – the individual projects and
activities - that will be undertaken by Council in 2012-13.
To deliver these, Council has 24 service areas that
are linked to the 7 external strategic objectives (or destinations) in
Parramatta Twenty25 and the 4 internal strategic objectives outlined in
Council’s Corporate Plan. For the purpose of this planning and reporting
framework, these are grouped under 4 pillars:
· Environment & Infrastructure
· Community & Neighbourhoods
· Economy & Development
· Governance &
Corporate
Council has also prepared a Resourcing Strategy which
includes a Long Term Financial Plan, Asset Management Plan, Workforce
Management Plan and Information, Communication & Technology Plan. The Delivery Program and Operational Plan have
informed and been informed by the Resourcing Strategy.
Parramatta Twenty25: What is it?
Parramatta
Twenty25 is the Community Strategic Plan for the Parramatta local government
area.
Parramatta
Twenty25 provides an agreed agenda and a clear long term direction for Parramatta. It brings together the identified and desired needs of the community and
business sector with state and regional level planning documents into one
document that is relevant to Parramatta. It is a community planning document
for the entire city and not simply for the Council. It is intended that all
stakeholders in Parramatta can use this document to understand the direction
and needs of the city.
There
are seven strategic objectives or destinations identified in Parramatta
Twenty25 for the city:
1. Land and Water that is protected,
respected and sustained
2. A society that is healthy and
compassionate
3. Businesses that are dynamic, prosperous
and socially responsible
4. Neighbourhoods that are liveable
and distinctive
5. A community that is diverse and
cohesive
6. People and places that are linked
by sustainable transport and communication networks
7. A city that is innovative and
inspirational
These
destinations have 34 strategies that are designed to support and achieve the
destinations.
|
Item 11.3 - Attachment 1
|
Draft Updated 2010/2014 Delivery Program and Draft
2012/13 Operational Plan (Distributed under separate cover to Councillors
and Senior Staff. For a copy pls contact council support on 98065314)
|
How the Community’s and Organisation’s strategic
objectives link to Council’s service areas
|
Plan
|
Strategic Objectives
|
Service Areas
|
Included in these
service areas
|
|
Community Strategic Plan
– Parramatta Twenty25
|
Environment &
infrastructure
Land and water that is
protected, respected and sustained
People and places linked by
sustainable transport
|
§ Roads, Footpaths & Drainage
§ Parking Facilities
§ Waste & Sustainability Programs
§ Trades & Fleet Management
§ Natural Areas Management
§ Cleansing Services
|
§ Civil assets maintenance & construction
§ Public asset audit, footpath construction &
maintenance
§ Cleansing services
§ Civil asset management
§ Capital projects
§ Paid parking major contracts
§ Waste management major contracts
§ Facilities & trades
§ Fleet services
§ Natural areas management
|
|
Community &
Neighbourhoods
A society that is healthy
and compassionate
Neighbourhoods that are liveable
and distinctive
A community that is diverse
and cohesive
|
§ Children & Family Services
§ Community, Youth & Seniors’ Services
§ Parks & Open Space
§ Arts & Culture
§ Library Services
§ Recreation Facilities & Programs
|
§ Home support & community services
§ Children & family services
§ Library services
§ Community capacity building
§ Community safety & crime prevention
§ Open space management
§ Parks maintenance
§ Recreation facilities & programs
§ Arts facilities & cultural programs (includes
Artist Studios)
§ Riverside Theatres & Connection Studios
|
|
Economy & Development
Businesses that are dynamic,
prosperous and socially responsible
A City that is innovative
and inspirational
|
§ Tourism & Events
§ Property Development
§ Regulatory Services
§ Development & Traffic Services
§ Town Planning & Urban Design
§ City Strategy & Place Services
|
§ Heritage & visitor information
§ Tourism development
§ Events
§ Civic Place & other property development
§ Community law & education
§ Environmental health & protection
§ Development assessment
§ Planning certificates
§ Certification
§ Land use planning & S94 management
§ Urban design services
§ City strategy (economic, environmental & social
policy & planning, place management & corporate planning)
§ Transport planning
§ Traffic facilities management
|
|
PCC Corporate Plan
|
Governance &
Corporate
A well governed and led
organisation that is service and community focused and communicates
effectively
Engaged and valued staff
working effectively to improve the way we do business
Responsive and best practice
management of Council’s finances, risk, procurement and assets
An organisation that plans
its future, improves systems & processes, measures its success and
compares its performance to others
|
§ Corporate, Governance & Councillor Services
§ Finance Management
§ Human Resources Management
§ Information Communication & Technology
§ Customer Relations & Communications
§ Strategic Asset & Property Management
|
§ Executive management
§ Governance, quality, corporate performance
§ Councillor support, civic events
§ Audit & legals
§ Finance, procurement, payroll, rates, insurance &
risk
§ Human resources
§ Information technology
§ Customer contact centre, research & consultation,
website & business information services
§ Marketing & communication
§ Asset & property management
|
ABOUT PARRAMATTA
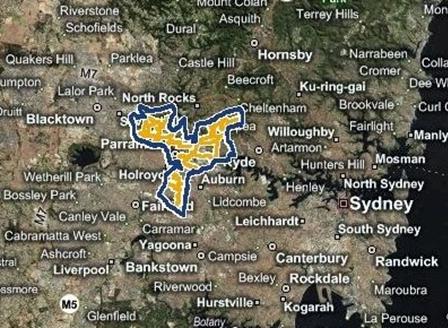 Parramatta City is located in Sydney’s western
suburbs, about 24 kilometres from the Sydney GPO. The City is bounded by
Baulkham Hills Shire and Hornsby Shire in the north, the City of Ryde in the east, the Auburn Council area, Bankstown City and Fairfield City in the south and Holroyd City and Blacktown City in the west.
Parramatta City is located in Sydney’s western
suburbs, about 24 kilometres from the Sydney GPO. The City is bounded by
Baulkham Hills Shire and Hornsby Shire in the north, the City of Ryde in the east, the Auburn Council area, Bankstown City and Fairfield City in the south and Holroyd City and Blacktown City in the west.
The
Australian Bureau of Statistics estimated Parramatta’s population at June 2010
to be 172,300. An updated
2011 population estimate is expected from the ABS in early April 2012.
Parramatta
City includes the suburbs of Camellia, Carlingford (part), Chester Hill, Clyde,
Constitution Hill, Dundas, Dundas Valley, Eastwood, Epping (part), Ermington,
Granville (part), Guildford (part), Harris Park (part), Melrose Park (part),
Merrylands (part), North Parramatta (part), Northmead (part), Oatlands (part),
Old Toongabbie, Parramatta (part), Pendle Hill (part), Rosehill, Rydalmere,
South Granville, Telopea, Toongabbie (part), Wentworthville, Westmead (part)
and Winston Hills.
Parramatta is named from an Aboriginal word meaning “the place
where eels lie down”. It was originally known as Rose Hill.
Parramatta City is a
predominantly residential area with substantial institutional, industrial and
commercial land use.
The
City encompasses a total land area of about 61 square kilometres.
Council’s Delivery Program
2010-14
Environment & Infrastructure
Council’s services that focus on Environment and
Infrastructure work to:
Ø Maintain local roads and associated infrastructure and
enhance cycleway and pedestrian networks
Ø Promote road safety and efficient traffic network
through transport planning, parking and traffic facilities
Ø Minimise impacts associated with flooding
Ø Provide waste and street cleaning services to ensure
the health and safety of the City and maintain its appearance
Ø Conserve and protect the natural systems and resources
within the City
Ø Support Council service delivery through provision of
trade and fleet services.
Key Challenges for the next 5 years:
Ø Ageing infrastructure – asset maintenance and renewal
Ø Infrastructure expansion to address population growth
and changed conditions, particularly new technology
Ø Potential for increased negative impacts on the
environment from population growth including increased waste, air pollution,
stormwater run-off and consumption of resources
Ø Erosion of waterways including damage to sea walls in
the Parramatta River
Ø Extreme weather events including drought and floods
Ø Long term management of waste and improved
environmental outcomes through waste reduction
Ø Connecting bushland and waterways corridors through
public and private land
Ø Finding new community volunteers to get involved in
bushland and other environmental programs.
Ø People and places that are linked by sustainable communication
networks
Ø Council assets that are sustainable.
|
The key strategic
objectives in Parramatta Twenty25 (Parramatta’s Community Strategic Plan)
related to Environment and Infrastructure are:
Ø Land and water that is protected, respected and
sustained
Ø People and places that are linked by sustainable
transport
|
To deliver these
objectives, Council will use partnerships, advocacy, projects and/or service
delivery to deliver the following strategies:
Ø protect and rehabilitate high priority waterways and
manage major impacts on medium and low priority waterways
Ø protect and rehabilitate core bushland areas and
manage major impacts on corridors and remnant bushland
Ø reduce human impacts on Parramatta’s unique
diversity of plants and animals
Ø protect and manage significant natural landscape
features and soil types
Ø reduce the risk to the community due to natural or
human made disasters
Ø reduce the consumption of non-renewable and scarce
resources
Ø facilitate the sharing of information and ideas
through remote communications
Ø manage road congestion and safety while reducing the
reliance on car use as a primary means of transport
Ø increase the number of people using public
transport, particularly for journeys to work
Ø increase the number of people walking and cycling,
particularly for journeys within the neighbourhood
Ø refurbishment of new buildings to incorporate
sustainable and environmentally appropriate elements wherever possible
Ø new buildings to be developed by PCC to incorporate
a high level of sustainability.
|
Council’s services that are linked to the delivery of
these objectives are:
|
Service Area
|
Included in this
service
|
Purpose (what we do)
|
Key Outputs (how we
do it)
|
Service Outcome (why
we do it)
|
|
Natural Areas Management
|
Natural areas management
|
Management of bushland and
riparian areas within the open space network.
|
Asset management strategies
and plans.
Contract management.
|
Maintain and improve the
natural areas network to an agreed standard.
|
|
Roads, Footpaths and
Drainage
|
Civil assets maintenance
and construction
|
Maintain civil
infrastructure
Construct minor civil
infrastructure.
|
Contract and in-house civil
works construction, assessment and maintenance
|
Safe and functional
infrastructure for public use.
|
|
Public asset audit,
footpath construction & maintenance
|
Audit the public domain.
|
Contract and in-house
public domain asset construction, assessment and maintenance.
|
Safe and functional public
domain
|
|
Civil Asset Management
|
Management of built
infrastructure in the public domain.
|
Asset Management Strategies
and Plans.
|
Maintain public assets to
an agreed standard.
|
|
Capital Projects
|
Design and construct
capital works to provide infrastructure and public space.
|
Design, construction and
project management.
|
Provide new or upgraded
public assets.
|
|
Trades & Fleet
Management
|
Facilities & Trades
|
Provide technical support
and management to units of council so as to assist them in the maintenance of
the facilities they occupy.
|
Repairs and maintenance
works undertaken. Production of street signs and banners as well as graffiti
removal.
|
Support delivery of a wide
range of efficient Council services, ensure building regulation compliance
and improved City presentation.
|
|
Fleet services
|
Provide plant and vehicles
for Council use in delivering services.
|
Purchase, maintenance and
disposal of plant and fleet.
|
Effective and functional
fleet to support service delivery.
|
|
Parking Facilities
|
Paid parking major
contracts
|
Management of the contract
for operation of multi level car parks and the contract for maintenance and
cash collection of parking meter machines.
|
Contract management.
|
Manage parking in the CBD.
|
|
Waste &
Sustainability Programs
|
Waste management
|
Management of contracts for
collection and processing of domestic garbage, recyclables and organic and
commercial waste.
|
Contract management
Residential &
commercial garbage collection
Residential bulk clean up
collection.
|
Public health and safety
and improved environmental outcomes through waste reduction and resource
recovery.
|
|
Cleansing Services
|
Cleansing service
|
The cleaning and removal of
litter from public land and places.
|
Street sweeping.
Litter collection &
Waste removal. Cleaning stormwater pits.
|
Public land is maintained
in a clean and safe condition.
|
Key Actions for Council
2010-14
|
Service Area
|
2010-11
|
2011-12
|
2012-13
|
2013-14
|
|
Natural Areas Management
|
Ø Implement priority works under Natural Area
Management plans including weeding and bush regeneration works.
|
Ø Enhanced river/stream care - water quality
Ø Expand bushwalking tracks in core areas
|
Ø Green the CBD (extensive tree planting)
Ø Increase community involvement in environmental
restoration projects.
|
Ø Increase community involvement in environmental restoration
projects.
|
|
Roads, Footpaths &
Drainage
|
Ø Further develop Strategic Asset Management Plan for
civil infrastructure
Ø Implement priority works under Pedestrian Access
Mobility Plan
Ø Implement priority works through road restoration
and rehabilitation program
Ø Commence condition assess of bridges
Ø Increase maintenance of stormwater assets
Ø Energy efficient street lighting
Ø Stormwater re-use strategies – strategy.
|
Ø Implement priority works under Pedestrian Access
Mobility Plan
Ø Implement priority works through road restoration
and rehabilitation program
Ø Stormwater asset replacement - resulting from asset
data capture project
Ø Fundamental review. Assess impact of developments
on infrastructure e.g. stormwater drainage
Ø Incorporate climate/social mitigation and adaptation
principles into all infrastructure planning
Ø Stormwater re-use strategies – strategy.
|
Ø Implement priority works under Pedestrian Access
Mobility Plan
Ø Implement priority works through road restoration
and rehabilitation program
Ø Stormwater re-use strategies – strategy
|
Ø Implement priority works under Pedestrian Access
Mobility Plan
Ø Implement priority works through road restoration
and rehabilitation program
Ø Stormwater re-use strategies – strategy.
|
|
Parking
Facilities
|
Ø Bus stop improvements
Ø Park and ride – promotions.
Ø Improve shared use cycleway connections including
Parramatta Valley Cycleway
|
Ø Program of sustainable transport initiatives (car
share, car pool, travel plans, commuter, cycle events
Ø Review parking charges (increase), linked to
environment impact
Ø Implement aspects of adopted Integrated Transport
Plan.
|
Ø Implement aspects of adopted City Centre Parking
Strategy and Integrated Transport Plan.
Ø Continue to implement bike network
Ø Western Sydney Light Rail feasibility study
Ø Western Sydney and City Centre Ring Roads
|
Ø Respond to State Government initiatives
Ø Implement aspects of adopted City Centre Parking Strategy and Integrated Transport Plan.
|
|
Waste &
Sustainability Programs
|
Ø Management of contracts for collection and
processing of kerbside material.
Ø Enhance recycling of kerbside cleanup materials.
|
Ø Management of contracts for collection and
processing of kerbside material.
Ø Re-tender waste collection service.
|
Ø Management of contracts for collection and processing
of kerbside material.
Ø Develop and progressively implement waste strategies
to ensure waste to landfill is significantly reduced and resource recovery is
optimised.
Ø Review and update Council’s Waste Avoidance and Resource
Recovery Plan.
|
Ø Management of contracts for collection and processing
of kerbside material.
Ø Develop and progressively implement waste strategies
to ensure waste to landfill is significantly reduced and resource recovery is
optimised.
|
Key performance measures
|
Resident satisfaction
measures
|
Target
|
Reporting Frequency
|
|
Percentage of resident
satisfaction with the condition of Council managed roads
|
50% satisfied or very
satisfied
|
Annual
|
|
Percentage of resident
satisfaction with street signage
|
70% satisfied or very
satisfied
|
Annual
|
|
Percentage of resident
satisfaction with the condition of cycleways
|
55% satisfied or very
satisfied
|
Annual
|
|
Percentage of resident
satisfaction with the condition of footpaths
|
45% satisfied or very
satisfied
|
Annual
|
|
Percentage of resident
satisfaction with the condition and maintenance of bus stops
|
65% satisfied or very
satisfied
|
Annual
|
|
Percentage of resident
satisfaction with Council promotion of sustainable transport
|
50% satisfied or very satisfied
|
Annual
|
|
Percentage of resident
satisfaction with Council’s management of bushland under its care and control
|
70% satisfied or very
satisfied
|
Annual
|
|
Percentage of resident
satisfaction with Council waste collection services
|
80% satisfied or very satisfied
|
Annual
|
|
Percentage of resident
satisfaction with the cleanliness of streets, parks and public spaces
|
75% satisfied or very
satisfied
|
Annual
|
|
Percentage of resident
satisfaction with Council’s management of human impacts on the environment
|
50% satisfied or very
satisfied
|
Annual
|
|
Percentage of resident
satisfaction with Council efforts to increase recycling
|
65% satisfied or very
satisfied
|
Annual
|
|
Percentage of resident
satisfaction with cleanliness of waterways
|
50% satisfied or very
satisfied
|
Annual
|
|
Other measures
|
Target
|
Reporting Frequency
|
|
Road pavement condition
index (PCI)
|
6.4
|
Annual
|
|
Number of metres of new
footpath installed
|
5,700 metres
|
Annual
|
|
Length of stormwater system
with upgraded capacity
|
600 metres
|
Annual
|
|
Number of drainage pits
with upgraded capacity
|
25
|
Annual
|
|
Number of new pedestrian
crossings installed
|
5
|
Annual
|
|
Average response rate
(days) to customer requests regarding pollution incidents
|
10
|
Quarterly
|
|
Length of waterways under
Council control that are rehabilitated
|
18 kilometres
|
Annual
|
|
Percentage rate of
diversion of residential waste from landfill
|
43%
|
Annual
|
Community & Neighbourhoods
Council’s services that
focus on Community and Neighbourhoods work to:
Ø Improve the social wellbeing of our communities,
particularly those most in need
Ø Enhance the capacity of the community and
non-government organisations working in Parramatta
Ø Maintain and enhance the community’s actual and
perceived safety
Ø Broker partnerships with community and government
agencies to maximise services available
Ø Address needs identified in planning documents
relating to homelessness and affordable housing
Ø Provide and maintain a network of open space and
recreation facilities throughout the City that promote a variety of active and
passive recreational opportunities for residents, workers and visitors
Ø Provide library and information services to develop,
support and promote community knowledge and learning opportunities
Ø Develop, support and promote a diversity of quality
arts programs and venue that build the cultural capacity of the City
Key Challenges for the
next 5 years:
Ø Responding to population growth and changing community
needs
Ø Health e.g. addressing inequality in health outcomes
and increasing demand for mental health services
Ø Improving housing affordability and reducing
homelessness
Ø Reducing negative impacts of social inequality on
individuals and communities
Ø Increasing both actual and perceived community safety
Ø Promoting social sustainability
Ø Stress on the Not for Profit Sector e.g. capacity
building “of the community”
Ø Decreasing funding for community services.
|
The key strategic
objectives in Parramatta Twenty25 (Parramatta’s Community Strategic Plan)
relating to Community and Neighbourhoods are:
Ø A society that is healthy and compassionate
Ø Neighbourhoods that are liveable and distinctive
Ø A community that is diverse and cohesive.
|
To deliver these
objectives, Council will use partnerships, advocacy, projects and/or service
delivery to deliver the following strategies:
Ø fulfil Parramatta’s regional responsibilities by
providing high level services to western Sydney
Ø improve the health of Parramatta’s community by
encouraging healthy lifestyles
Ø develop a range of education opportunities to meet
the needs of Parramatta’s community
Ø develop affordable housing and accommodation to meet
the needs of Parramatta’s residents
Ø improve the quality of life for people who are
requiring support
Ø assist people to gain employment by providing access
to skills development and other support
Ø plan for concentrated growth of housing around
transport and activity nodes rather than dispersed growth throughout the LGA
Ø encourage business to locate and prosper in
neighbourhood centres
Ø reduce incidence of crime and ensure that Parramatta
is perceived as a safe place by day and by night
Ø improve the integration of natural and built
environments
Ø create clean and attractive streets and public
places particularly around neighbourhood centres
Ø provide local opportunities for recreation, leisure
and sport
Ø create a strong sense of neighbourhood identity
Ø acknowledge and respect the Aboriginal community as
the traditional custodians of Parramatta
Ø protect and celebrate Parramatta’s rich
multi-layered built and cultural heritage
Ø support and promote community groups which create
community interaction and cohesion.
|
Council’s services that
are linked to the delivery of these objectives are:
|
Service Area
|
Included in this
service
|
Purpose (what we do)
|
Key Outputs (how we
do it)
|
Service Outcome (why
we do it)
|
|
Children
& Family Services
|
Children
& Family Services (child care services & facilities)
|
Ø Provide facilities, staff & support to implement
Children’s Services programs for the benefit of families & children.
|
Ø High quality early learning services.
|
Ø Children cared for in safe and supportive
environments.
Ø Early learning and development results in children
with a firm basis for success in life.
|
|
|
Arts & Culture
|
Arts Facilities and
Cultural Programs
|
Ø Manage and facilitate the provision of quality and
accessible arts facilities and cultural programs for the City.
|
Ø Providing Parramatta Artist Studios and coordinating
Arts policy and programs
Ø Providing affordable and accessible opportunities
for production, presentation and participation in arts and culture.
|
Ø To promote the City as a creative and vibrant place
Ø To emphasise and challenge experiences of the
historical and contemporary cultural heritage of the City.
|
|
|
Riverside Theatres and
Connection Studios
|
Ø Manage, co-ordinate and transact the business and
administrative requirements of Riverside’s venue hire and performance venture
activities.
|
Ø Providing a diverse theatre program
Ø Supporting development of new cultural products
Ø Supporting professional development of artists
Ø Providing a venue for community events.
|
Ø To promote the City as a creative and vibrant place.
Ø To develop awareness and understanding of
Parramatta’s cultural heritage and identity.
Ø To provide social, cultural and leisure benefits to
individuals and communities.
|
|
|
Community,
Youth & Seniors’ Services
|
Home
support & community services (aged & disability services)
|
Ø In partnership with Government and non-Government
organisations, manage a range of targeted aged and disability services across
the LGA to meet the needs of the community.
|
Ø Social support
Ø Health promotion
Ø Lawn mowing
Ø Support to carers
Ø Low cost nutritional meals.
|
Ø Improve the quality of life for older people and
those with disabilities and enable them to remain in their homes.
|
|
-
Community Capacity Building |
Ø Build capacity of individual residents and their
communities to actively engage and self advocate.
Ø Work with Council, communities and the third sector
to act as a catalyst for positive social change to build strong sustainable
communities.
|
Ø Deliver community events
Ø Administer Community grants program
Ø Attract external grants for social support/inclusion
to Parramatta agencies
Ø Active community groups supporting social
service/inclusion in Parramatta.
|
Ø Community members as positive participants and
leaders in building and implementing community goals locally.
Ø Community organisations which are strong and
strategically focussed to understand and meet local community need.
|
|
-
Community Safety & Crime
Prevention |
Ø Development and implementation of crime community
crime prevention strategies.
|
Ø Crime prevention measures including CCTV, CPTED and
liaison with Police
|
Ø Improved perception of safety in our City
|
|
|
Parks
& Open Space
|
Open
Space Management
|
Ø Plan for the efficient management and enhancement of
Council’s open space and recreation areas.
|
Ø Implement Asset Management Strategies and Plans to
construct and maintain open space assets.
|
Ø Maximise the wide range of individual and community
benefits derived from Council’s open space assets.
|
|
-
Parks Maintenance |
Ø Maintain and improve Council’s open space and
recreation areas.
|
Ø Contract and in-house parks maintenance including
mowing, gardens and nursery.
|
Ø Well maintained and safe parks and reserves.
|
|
|
Library Services
|
Library
Services
|
Ø Deliver quality Library services that respond to the
communities needs for information, learning and leisure.
|
Ø Providing libraries and maintaining library
collections
Ø Provide access to technology and to recreational and
educational programs for the community.
|
Ø To provide a gateway to life-long learning,
recreation and information opportunities to support a high quality of life.
|
|
|
Recreation Facilities
& Programs
|
Recreation
facilities & programs
|
Ø Provide access to a range of quality community
recreation and leisure facilities that meet the needs of the community
Ø Provide management, development and support for a
range of recreation programs.
|
Ø Management of Granville and Parramatta Pools,
Granville Youth and Community Recreation Centre, Woodville Golf Course and
Council’s tennis facilities and associated recreation programs.
|
Ø Socio-economic benefits, enhanced life skills and
improved levels of physical fitness and health.
Ø Secondary effects include higher educational
standards, more prosperous local economies and stronger, safer communities in
which everyone can make a contribution.
|
|
|
|
|
|
|
|
|
Key Actions for Council 2010-14
|
Service Area
|
2010-11
|
2011-12
|
2012-13
|
2013-14
|
|
Children & Family
Services
|
Ø Develop and implement the NSW Early Learning Years
Framework (ELYF) across Council’s Early Learning Centres
|
Ø Develop and implement the NSW Early Learning Years
Framework (ELYF) across Council’s Early Learning Centres
|
Ø Implement the Education and Care
Services National Regulations across the Early Learning Centres.
|
Ø Develop an Implementation Plan for the next stage of
the Education and Care
Services National Regulations across the Early Learning Centres.
|
|
Arts & Culture
|
Ø Establish professional ongoing performance
production unit for Riverside Theatres
Ø Negotiate new funding arrangement with State &
Federal Governments for Riverside Theatres
Ø Clarification and development of a gallery
Ø Implement the Parramatta Cultural Trust
Ø Facilitate the development of arts/business
relationships – creative enterprise broker.
Ø Negotiate new funding arrangement with State &
Federal Governments for Parramatta Artists Studios
Ø Review Arts Facilities and Cultural Places framework
|
Ø Promote cultural and creative industries
Ø Review Arts Facilities and Cultural Places framework
Ø Develop both short and long term development plans
to enhance Riverside Theatres complex
Ø Develop a mini-festival at Riverside Theatres
Ø Facilitate expanded arts precinct and confirm
Councils role in the development and future operations of the Old Kings
School precinct
Ø Negotiate new lease for Parramatta Artists Studios
or relocate to Old Kings School
|
Ø Develop promotional signage for Riverside throughout
Parramatta City Centre
Ø Refurbish Riverside foyers
Ø Seek funding for development of Riverside Theatres.
Ø Seek funding for Parramatta Artists Studios
Ø Seek ongoing commitment for the Creative Broker
position and for Pop Up Parramatta
Ø Facilitate expanded cultural precinct and confirm
Council’s role in the development and future operations of the Old Kings
School precinct
|
Ø Make Riverside technology best practice in
performance.
Ø Facilitate expanded cultural precinct and confirm
Councils role in the development and future operations of the Old Kings
School precinct
Ø Promote cultural and creative industries
|
|
Community, Youth &
Seniors’ Services
|
Ø Resource and support the Parramatta Homelessness
Interagency to develop its five year strategic plan to reduce homelessness in
Parramatta
Ø Social Enterprise identification and development
Ø Community sector engagement and skill building
Ø Establish baseline Social Wellbeing measure for
Parramatta
Ø Policy development around health and wellbeing,
physical activity
Ø Develop integrated CCTV Strategy and Policy
Ø Develop LGA Crime Prevention Plan
Ø Develop Sex Services Premises - Enforcement policy,
standard operating procedures, Lobby State Govt for Legislative Change
Ø Not for Profit Governance and Management Support
Ø State of the community sector social research.
Ø Access to Community Facilities (links to Strategic
Asset Management)
|
Ø Support the implementation of the Parramatta Homelessness
Interagency’s Strategic Plan
Ø Social Enterprise identification and development
Ø Community sector engagement and skill building
Ø Establish baseline Social Wellbeing measure for
Parramatta
Ø Implement policy around health and wellbeing,
physical activity
Ø Implement integrated CCTV Strategy and Policy 2010
Ø Implement LGA Crime Prevention Plan
Ø Not for Profit Governance and Management Support
Ø Social Networking Pilot - integrating disadvantaged
people into valued activities.
Ø Access to Community Facilities (links to Strategic
Asset Management)
Ø Expansion of programs to support young adults - HSC
and Social and Health and Community Engagement
Ø Programs to reach CALD communities - outreach and in
partnership with community partners NGO's.
Ø Expansion of over 50's Leisure and Learning Service
across Parramatta.
|
Ø Support the implementation of the Parramatta
Homelessness Interagency’s Strategic Plan
Ø Social Enterprise identification and development
Ø Community sector engagement and skill building
Ø Implement ongoing measurement against baseline social
well being measure for Parramatta
Ø Implement integrated CCTV Strategy and Policy 2010
Ø Implement LGA Crime Prevention Plan
Ø Social Networking Pilot - integrating disadvantaged
people into valued activities.
Ø Access to Community Facilities (links to Strategic
Asset Management)
Ø Expansion of over 50's Leisure and Learning Service
across Parramatta.
Ø Expansion of programs to support young adults - HSC
and Social and Health and Community Engagement
Ø Expanding Exhibition and public program / education
programs to engage diverse communities, particularly those who are hidden.
|
Ø Support the implementation of the Parramatta
Homelessness Interagency’s Strategic Plan
Ø Social Enterprise identification and development
Ø Community sector engagement and skill building
Ø Implement ongoing measurement against baseline social
well being measure for Parramatta
Ø Implement integrated CCTV Strategy and Policy 2010
Ø Implement LGA Crime Prevention Plan.
Ø Expansion of over 50's Leisure and Learning Service
across Parramatta.
Ø Expansion of programs to support young adults - HSC
and Social and Health and Community Engagement
Ø Expanding Exhibition and public program / education
programs to engage diverse communities, particularly those who are hidden.
Ø Access to Community Facilities (links to Strategic
Asset Management)
|
|
Parks & Open Space
|
Ø CBD park upgrades
|
Ø Stormwater re-use to irrigate ovals
Ø Development of an additional playing field in the
LGA
|
Ø CBD park upgrades
Ø Stormwater re-use to irrigate ovals
|
Ø CBD park upgrades
Ø Development of a district park
Ø Stormwater re-use to irrigate ovals.
|
|
Library Services
|
Ø Develop major web presence for the Library
Ø Development of community literacy project - Paint
Parra Read.
|
Ø Develop and implement 24/7 reference service and
major web presence for library
Ø Develop flexible service delivery model for Library
Ø Library collection development focussed on ebooks
and eresources
Ø Provide online access to collections
Ø Implement new technology for visitors experience -
pod casts tours
Ø Renovation of branch libraries to create
environmentally sustainable welcoming community spaces
Ø Development of community literacy project - Paint
Parra Read
|
Ø Develop and implement new Library management system
Ø Provide online access to collections
Ø Programs to reach CALD communities - outreach and in
partnership with community partners NGO's
Ø Renovation of branch libraries to create
environmentally sustainable welcoming community spaces
|
Ø Provide online access to collections
Ø Programs to reach CALD communities - outreach and in
partnership with community partners NGO's
Ø Renovation of branch libraries to create
environmentally sustainable welcoming community spaces
|
|
Recreation Facilities
& Programs
|
Ø Facilities audit mapped against / to recreation
guidelines linking to transport
Ø Accessibility of facilities e.g. public halls,
community centres, sports grounds and programs.
|
Ø Technology enhancements to facilities to allow online,
cashless booking
Ø Increased non-structured recreational facilities
within parks
Ø Enhancements to Woodville Golf Course
Ø Facilities audit mapped against / to recreation
guidelines linking to transport
Ø Accessibility of facilities e.g. public halls,
community centres, sports grounds and programs.
Ø Refurbishment of Parramatta Town Hall roof
|
Ø Facilities to allow online, cashless booking –
further development & enhancement of systems
Ø Advocate for accessible facilities e.g. gyms
Ø Feasibility study indoor sports centre
Ø Aquatic dome to assist in the development of Swim
School / L2S
Ø Refurbishment of Parramatta Town Hall roof
Ø Review of the Sport and Recreation Plan
Ø Refurbishment and upgrade of tennis courts at
Caroline Chisholm
|
Ø Audit and delivery of a Tennis Facility Strategy
Ø Feasibility study indoor sports centre
Ø Feasibility of installation of Aquatic
dome to assist in the development of Swim School / L2S
|
Key performance measures
|
Resident satisfaction
measures
|
Target
|
Reporting Frequency
|
|
Percentage of residents who
feel safe in the city and local areas
|
City Centre 73%
Local Areas 76%
|
Annual
|
|
Percentage of resident
satisfaction with the quantity and quality of Council owned/managed
recreation facilities and opportunities in the City
|
63% satisfied or very
satisfied with quantity and 61% quality
|
Annual
|
|
Percentage of resident
satisfaction with the quality of library services
|
73% satisfied or very
satisfied
|
Annual
|
|
Percentage of resident
satisfaction with Riverside Theatres
|
65% satisfied or very
satisfied
|
Annual
|
|
Other measures
|
Target
|
Reporting Frequency
|
|
Percentage of people
receiving Council provided human services compared to registered demand
|
%
|
Annual
|
|
Percentage of users
satisfied with Child Care services
|
93%
|
Annual
|
|
Percentage of users
satisfied with Home Support services
|
92%
|
Annual
|
|
Percentage of community
based support organisations who are satisfied with the support provided by
Council
|
% satisfied or very
satisfied
|
Annual
|
|
Percentage of user group
satisfaction with the quantity and quality of Council owned/managed
recreation facilities and opportunities in the City
|
81% satisfied or very
satisfied with quantity and 93% quality
|
Annual
|
|
Percentage of user
satisfaction of recreation and sports organisations with support provided by
Council
|
72%
|
Annual
|
|
Percentage of user
satisfaction with the quality of library services
|
85%
|
Annual
|
|
Percentage of user
satisfaction with the accessibility of library services
|
85%
|
Annual
|
|
Percentage of user
satisfaction with the availability library services
|
81%
|
Annual
|
|
Number of visits to
Council’s libraries
|
804,300
|
Annual
|
|
Number of visits to
Council’s library website
|
87,200
|
Annual
|
|
Number of events and
exhibitions at Riverside Theatres
|
700
|
Annual
|
|
Average level of attendance
at Riverside Theatres
|
110,000
|
Annual
|
|
Percentage of client
satisfaction at Riverside Theatres
|
90%
|
Annual
|
Economy & Development
Council’s services that
focus on Economy and Development work to:
Ø Support, develop and promote opportunities for
sustainable business growth and improvement
Ø Attract visitors to Parramatta
Ø Improve the way Parramatta looks and works by
enhancing public spaces and regenerating the City Centre and neighbourhood
centres
Ø Express and promote the City’s identity by organising
events and festivals that engage and reflect the entire Parramatta community
Ø Know, value and care for the City’s rich cultural
heritage
Ø Maintain and improve the safety and amenity of Council
residents, community and the environment by appropriately enforcing the
relevant Acts and Regulations
Ø Effectively and equitably regulate the development and
use of land.
Ø Promote quality urban design and sustainable land use
management within the Parramatta Local Government Area.
Key Challenges for the
next 5 years:
Ø Promote employment growth
Ø Harnessing the opportunities of human
capital/knowledge based employment
Ø Target industry/employers to locate to Parramatta
Ø Protection of employment lands to ensure sustainable
growth
Ø Creating a city with positive amenity/culture/buzz and
target younger workers
Ø Redevelopment of key council owned lands including
Civic Place
Ø Identifying appropriate lands for targeted industries
Ø Managing population growth and identifying appropriate
land for new sustainable development
Ø Address the negative safety perceptions of Parramatta
Ø Developing and marketing the City's brand (how residents, workers and visitors identify
with the city).
Ø Creating a city that is resilient to climate extreme
Ø Developing a green economy within the City
Ø Ensuring that services meet the needs of a diverse
community, considering the issue of affordable housing and homelessness
Ø Seeking state and federal government support for key
transport and infrastructure needs
Ø Responding to increasing incidence of unauthorised
building and development works
Ø Increase market share for certification services
Ø Continue to improve the efficiency of development
assessment services
Ø Responding to new planning system and related
legislative changes
|
The key strategic objectives
in Parramatta Twenty25 (Parramatta’s Community Strategic Plan) related to
Economy & Development are:
Ø Businesses that are dynamic, prosperous and socially
responsible
Ø A City that is innovative and inspirational.
|
To deliver these
objectives, Council will use partnerships, advocacy, projects and/or service
delivery to deliver the following strategies:
Ø plan for and promote the clustering of specific
business and industry sectors in commercially appropriate locations
Ø ensure that business is supported through education,
training and research
Ø develop and promote Parramatta as THE place to visit
Ø encourage ethical businesses which act responsibly
towards the community and natural environment
Ø fulfil Parramatta’s regional responsibilities by
providing high level cultural facilities to western Sydney
Ø develop a range of creative industries and
opportunities for artistic expression
Ø provide an exciting and engaging range of events and
entertainment opportunities
Ø develop Parramatta as a leading City for research and
development and technological innovation.
Ø deliver profitable property and development projects
|
Council’s services that
are linked to the delivery of these objectives are:
|
Service Area
|
Included in this
service
|
Purpose (what we do)
|
Key Outputs (how we
do it)
|
Service Outcome (why
we do it)
|
|
Development and Traffic
Services
|
Development Assessment
|
Ø Implement state, regional and local planning
policies.
|
Ø Provide advice to Council and stakeholders in all
aspects of the DA process
Ø Provide pre-lodgement information
Ø Assess and determine DAs
Ø Provide support to Council in appeals.
|
Ø Guide and facilitate development.
|
|
Planning Certificates
|
Ø Provide statutory information for property owners
and purchasers
|
Ø S149 (Planning Certificates)
|
Ø Provide accurate & timely property data
|
|
Certification
|
Ø Undertake development certification services
|
Ø Construction Certificates
Ø Occupation Certificates
|
Ø Development which complies with community standards
|
|
Traffic Facilities
Management
|
Ø To promote road safety and awareness, and promote a
more efficient traffic network.
|
Ø Traffic infrastructure works to manage the safety,
speed and efficiency of traffic. Administration of Parramatta Traffic
Committee and Traffic Engineers Advisory Committee.
|
Ø Safer, more efficient road network in Parramatta.
|
|
City Strategy &
Place Services
|
City Strategy
Place Services
Transport Planning
|
Ø Undertake and integrate strategic research, analysis
and planning across social, environmental and economic areas
Ø Co-ordinate opportunities / risks affecting 2025
outcomes.
Ø Corporate planning and business improvement.
Ø Review and benchmark services across the
organisation
Ø Ensure Council meets integrated/City Strategy
planning requirements
Ø Prepare policies, strategies, promoting and lobbying
for more sustainable transport.
|
Ø Research and analysis, strategic advice, initiate
and develop innovative projects and manage strategic partnerships.
Ø Integrate this activity across environmental,
social, & economic areas, with a focus on making it work in places
Ø Provide advice and analysis of Place based issues
Ø Service level agreements and Project briefs (with
partners)
Ø Simplified business/service planning cycle, approach
and support
Ø Develop and agree a methodology for services review
Ø Initiate the services review process
Ø Engage Leadership Team and Councillors in planning
process
Ø Policies, strategies and plans relating to
sustainable transport
Ø Research and lobby State and Federal governments.
|
Ø To ensure Parramatta City Council is a leader in
the industry.
Ø To provide comprehensive, timely and strategic
information to decision makers
Ø To prepare the Council for the challenges of the
future
Ø To foster innovation and creative problem solving
Ø Integration of the “triple bottom line” into all
Council business (and to the benefit of the community).
Ø Improve management of the business
Ø Improvements in efficiency, cost effectiveness or
customer service of everything we do
Ø Ensure Council is an industry leader.
Ø Higher awareness of sustainable transport in
Parramatta and recognition of Parramatta’s transport needs in State
Government.
|
|
Regulatory Services
|
Community Law and Education
|
Ø Parking patrols and program to provide vehicle turn
over in CBD and public safety & enforce legislation.
|
Ø Parking monitoring and enforcement through patrols
and programs; school zones and mobility parking
Ø Monitor animal control through registration,
education and enforcement of legislation
Ø Promote and educate the public on local laws
enforcement of public areas.
|
Ø Provide safe and orderly parking and enforcement
that is fair and equitable
Ø Promote a safe community through enforce of local
laws
Ø To protect the public and animal welfare by
providing animal registration and enforcement.
|
|
Environmental Health &
Protection
|
Ø Enforce and regulate relevant legislation relating
to health, environment, development, construction and fire safety.
|
Ø Monitor regulated premises through inspection
programs.
Ø Provide education, advice and enforcement of Health,
Environment, Planning and related legislation.
|
Ø To promote public safety, health and environmental
standards
Ø To protect and enhance the natural and built
environment.
|
|
Town
Planning & Urban Design
|
Land
Use Planning & S94 Management
|
Ø Provide land use planning service for Council.
|
Ø Create and amend LEPs, DCPs and other land use
policy instruments
Ø Consider and process applications for rezoning
Ø Administer S94 and Heritage management and planning.
|
Ø Control and guide development in a manner that is
sustainable and consistent with both local and regional urban policy.
|
|
Urban Design Services
|
Ø Provide advice and input into development
assessment, public domain plans/works and policy formulation relating to
urban development.
|
Ø Urban design advice on significant DAs
Ø Advice and input to assist with the formulation of
planning controls and guidelines
Ø Administration and monitoring of design competitions
Ø Advice and input into Council owned land development
projects and guidelines.
|
Ø Improvement of the urban landscape.
|
|
Property Development
|
Property Development
|
Ø Develop Council’s property portfolio
|
Ø Development of a property portfolio to deliver
commercial returns.
|
Ø Increase PCC’s financial sustainability by
increasing income, reducing costs and ensuring the life cycle costing of
assets are minimise while delivering the best condition of asset possible.
|
|
Civic Place Redevelopment
|
Ø Deliver Civic Place consistent with Master Plan and
Project Development Agreement.
Ø Successfully change manage the move to Civic Place
facilities.
|
Ø Acquire Darcy Street properties.
Ø Manage investment and property portfolio.
Ø Design and change manage the move
Ø Integrate workplace culture needs and service goals
into our new Civic Place environment.
|
Ø New community and Council facilities including
public open space as well as commercial, retails and residential space
Ø Stimulated economic activity and improved social and
environmental outcomes.
Ø More efficient services.
|
|
Tourism & Events
|
Cultural Heritage &
Visitor Information (PHVIC) &Tourism Development
|
Ø Promote engagement with Parramatta's unique identity
and its cultural heritage, both historic and contemporary.
Ø Develop and promote Parramatta as a destination for
visitors.
|
Ø Providing a range of heritage services and resources
to various audiences.
Ø Understanding the visitor market and their needs,
recognising and promoting opportunities for enhanced visitor experiences.
|
Ø Develop awareness and understanding of Parramatta’s
cultural heritage and identity.
Ø Increase visitor numbers to the city and
enhance quality visitor experiences.
|
|
Major Events
|
Ø Provide a program of high quality, sustainable major
and community events.
|
Ø Directly producing events, and attracting events to
Parramatta.
|
Ø Position Parramatta as a creative and dynamic
destination.
Ø Social, cultural and leisure benefits to individuals
and communities.
|
Key Actions for Council
2010-14
|
Service Area
|
2010-11
|
2011-12
|
2012-13
|
2013-14
|
|
Development and Traffic
Services
|
Ø Technological enhancements. Introduction of on line
planning tool. Development controls / standards. Self assessment
Ø Capability of planners to assess applications for
development in timely manner to encourage development and coherent of
targets. Skills assessment. Resource allocation.
|
Ø Implement e-planning tools:
- enhance existing Track
and Report
- establish Plan (requests
for planning controls for properties)
- establish Assess (self
assessment)
- on line lodgement of
applications
Ø Revise business practices/procedures arising from
technology enhancements.
|
Ø Review implementation of e-planning tools and
explore further technology enhancements
Ø Review impacts on technology on business processes
and resource allocation and training/skills of planners.
Ø Respond to changes to planning legislation and
review operations of business unit.
Ø Seek external Quality Assurance Accreditation of
business processes.
|
Ø Review implementation of e-planning tools and
explore further technology enhancements
Ø Review impacts on technology on business processes
and resource allocation and training/skills of planners.
Ø Respond to changes to planning legislation and
review operations of business unit.
|
|
City Strategy &
Place Services
|
Ø Embed new reporting framework including year 1 of 4
year Delivery Program and Annual Report 2009-10
Ø Develop 2011-12 Operational Plan
Ø Implement Service Review
Ø Wireless City
Ø Infuse TBL into core business
Ø Implement the Environmental (Integrated Water)
Improvement Program
Ø Review and update Council’s Biodiversity Plan
Ø Develop Homelessness Policy and Implementation Plan
Ø Implement Affordable Housing Actions – year 1 – 2
Ø Manage strategic health and housing partnerships and
projects
Ø Undertake a series of activities to promote the city
Ø Provide strategic information to business community
and analysis changes in economic development – Biz Facts etc
Ø Implement Town and Neighbourhood Centre Improvements
Ø Coordinate planning for key city sites such as
Horwood Place and Riverbank
Ø Implement City Infrastructure Program including
upgrades to Church Street North Parramatta
Ø Reform Places Services with an operational and
strategic role
|
Ø Develop 2012-13 Operational Plan
Ø Plan for review of Community Strategic Plan
Ø Review and update Council’s Climate Action Plan
Ø Prepare and implement the Parramatta Estuary
Management Plan
Ø Homelessness Implementation Plan – year 1
Ø Implement Affordable Housing Actions year 2 – 3
Ø Manage strategic health and housing partnerships and
projects
Ø Undertake a series of activities to promote the city
Ø Develop a business Tourism Strategy
Ø Provide strategic information to business community
and analysis changes in economic development – Biz Facts etc
Ø Implement Town and Neighbourhood Centre Improvements
Ø Coordinate planning for key city sites
Ø Implement City Infrastructure Program
Ø Planning relocation to Civic Place and Operations
Centre
Ø Imbed process improvement changes
|
Ø Review Community Strategic Plan
Ø Review Delivery Program
Ø Develop 2013-14 Operational Plan
Ø Homelessness Implementation Plan – year 2
Ø Implement Affordable Housing Actions year 3 – 4
Ø Manage strategic health and housing partnerships and
projects
Ø Undertake a series of activities to promote the city
Ø Implement Town and Neighbourhood Centre Improvements
Ø Coordinate planning for key city sites
Ø Implement City Infrastructure Program
Ø Planning relocation to Civic Place and Operations
Centre
|
Ø Develop 2014-15 operational plan
Ø Review and update the Parramatta River Foreshore
Plan
Ø Review and update Council’s Environmental Policy and
Targets.
Ø Homelessness Implementation Plan – year 3
Ø Implement Affordable Housing Actions year 4 – 5
Ø Manage and Review strategic health and housing
partnerships and projects
Ø Undertake a series of activities to promote the city
Ø Implement Town and Neighbourhood Centre Improvements
Ø Coordinate planning for key city sites
Ø Implement City Infrastructure Program
Ø Relocation to Civic Place and Operations Centre
|
|
Regulatory Services
|
Ø Increase food/regulated inspection program to meet
demands and food (agreement) act
Ø Market and brand field staff and vehicles fit for
purpose.
|
Ø Increase food/regulated inspection program to meet
demands and food (agreement) act.
Ø Implement parking monitoring programs for all areas
and business centres
Ø Provide a micro chipping animal service for
Parramatta residents
Ø Review, trial and evaluate mobile technology for use
by field staff
|
Ø Increase food/regulated inspection program to meet
demands and food (agreement) act.
Ø Increase return rates of animals
Ø Implement mobile technology for staff
Ø Commence review of Enforcement Policies
Ø Provide for on-line booking systems for PCA
|
Ø Increase food/regulated inspection program to meet
demands and food (agreement) act.
Ø Increase return rates of animals
Ø Review the operation of the parking Review Panel
|
|
Town Planning &
Urban Design
|
Ø Develop public domain guidelines
Ø Joint study of Epping planning controls with Hornsby
Council
Ø Review design competition guidelines.
Ø Prepare amended S94A developer contributions plan.
Ø Public exhibition of new draft LEP & DCP
|
Ø Complete review of heritage list & prepare LEP
amendment
Ø Finalise LEP and commence consolidation with city
centre LEP & DCP, together with review of City Centre controls
Ø Develop planning controls for the River Road
West/Rosehill precinct
Ø Finalise Parramatta Public Domain Guidelines
for City Centre and local streets
Ø Prepare and exhibit Westmead Precinct Planning
Strategy
Ø Prepare urban design analysis and planning controls
for the auto alley precinct
Ø Commence review of land acquisition reservations
Ø Develop project for designing City Centre Public
Domain Upgrades as per Civic Improvement Plan
Ø Develop Lanes Activation Projects for City Centre
|
Ø Finalise LEP amendment in response to Heritage
Review
Ø Finalise consolidation of City Centre LEP &
DCP and wider LEP & DCP
Ø Develop Public Domain Guidelines for Centres
Ø Finalise Westmead LEP amendments
Ø Finalise LEP/DCP Amendments for River Road
West/Rosehill Precinct
Ø Finalise LEP amendments for review of land
acquisition reservations
Ø Develop Parramatta Public Domain Guidelines
for City Centre
Ø Commence house keeping amendments relating to
new LEP
Ø Finalise project for Designing City Centre Public
Domain Upgrades
Ø Develop Lanes Activation Projects for City Centre
|
Ø Review of Planning controls for the Woodville Road
precinct
Ø Review and updates to LEP & DCP
|
|
Property Development
|
Ø Develop versatile buildings
Ø Continue the commercialisation of Council’s
redundant lands through the LEP process
Ø Consolidate and develop sites.
|
Ø Develop sites owned by Council
Ø Develop versatile buildings
Ø Design partner 2nd major project
Ø Continue the commercialisation of Council’s
redundant lands through the LEP process
Ø Consolidate and develop sites.
|
Ø Develop versatile buildings
Ø Develop hubs
Ø Market hubs
Ø Invest in high yield investments
Ø Start 2nd major project and investigate 3rd major
project
Ø Continue the commercialisation of Council’s
redundant lands through the LEP process
Ø Consolidate and develop sites.
|
Ø Start 3rd major project.
|
|
Tourism & Events
|
Ø Develop a festival of international significance for
Parramatta
Ø Focus on marketing Parramatta as a centre for
innovation
Ø Engage resources for tourism development and
management
Ø Develop local tourism product
Ø Develop a leisure brand for the City
|
Ø Activate the river foreshore
Ø Develop strategy to position Parramatta as an events
destination
Ø Engage resources for tourism development and
management
Ø Develop local tourism product
Ø Develop a leisure brand for the City
Ø Implement priority actions from the Visitation
Strategy
|
Ø Engage resources for tourism development and
management
Ø Develop local tourism product
Ø Develop a leisure brand for the City
Ø Implement priority actions from the Visitation
Strategy
Ø Attract major events to Parramatta
|
Ø Develop Local Tourism Product
Ø Implement priority actions from the Visitation
Strategy
Ø Attract major events to Parramatta
|
Key performance measures
|
Resident satisfaction
measures
|
Target
|
Reporting Frequency
|
|
Percentage of resident
satisfaction with Parramatta Heritage and Visitor Information Centre
|
60% satisfied or very
satisfied
|
Annual
|
|
|
|
|
|
Other measures
|
Target
|
Reporting Frequency
|
|
Number of events and
exhibitions at the Parramatta Heritage and Visitor Information Centre
|
11
|
Annual
|
|
Average level of attendance
at the Parramatta Heritage and Visitor Information Centre
|
60,000
|
Annual
|
|
Percentage of client
satisfaction with the Parramatta Heritage and Visitor Information Centre
|
93%
|
Annual
|
|
Number of Parramatta City
Centre businesses who believe that Parramatta is good value for money
|
60%
|
Annual
|
|
Mean time (net calendar
days) for determination of DAs
|
40
|
Quarterly
|
|
Median time (net calendar
days) for determination of DAs
|
35
|
Quarterly
|
|
Mean time (gross calendar
days) for determination of DAs
|
60
|
Quarterly
|
|
Median time (gross calendar
days) for determination of DAs
|
55
|
Quarterly
|
|
Percentage of DAs
determined within 40 days (net calendar days)
|
75%
|
Quarterly
|
|
Percentage of food shops
inspected
|
100%
|
Quarterly
|
|
Percentage of micro chipped
animals returned to their owners
|
65%
|
Quarterly
|
Governance & Corporate
Council’s services that
focus on Governance and Corporate work to:
Ø Maintain the
highest level of good governance, teamwork, probity, openness, accountability,
timeliness and compliance with legislation
Ø Develop strategies which are relevant to Council’s
partners and the community and set priorities for organisational focus and
action
Ø Ensure Council services and projects reflect the needs
of our community and partners are implemented according to adopted strategies
Ø Ensure Council finances and assets are strategically
planned and managed to secure Council’s long term future
Ø Provide a “great
place to work” where Council values and behaviours are demonstrated and upheld
by all Staff and Councillors.
Key Challenges for the
next 5 years:
Ø Future Pathways
- 2025 Integrated Planning, Services Review continuous improvement
Ø Change Government - Open Government
Ø Technology
Ø Financial Sustainability
Ø Changing workforce
Ø Industry Leader - Best Practice
Ø Population Need - Customer Service
Ø Building leadership capability to deliver at all
levels
Ø Cultural change
Ø Implementing IT solutions which minimise the need for
HR operations and advice.
Ø New Operations Centre
Ø Strategic Management of assets to ensure acceptable
service standards
|
The key strategic
objectives are:
Ø An organisation that plans its future, improves
systems and processes, measures its success and compares its performance to
others
Ø Responsive and best practice management of Council’s
finances, risk, procurement and assets
Ø Build a high performance culture and Become an
Employer of Choice
Ø A well governed and led organisation that is service
and community focussed and communicates effectively.
|
Strategies to deliver
these objectives include:
Ø Stabilise the business financially
Ø Improve technology to support business effectiveness
Ø Champion innovation and continuous improvement
Ø Demonstrate leadership in sustainability (triple
bottom line)
Ø Improve stakeholder relationship management
Ø Embed a customer service culture internally and
externally
Ø Introduce a robust performance management system
Ø Continue leadership development at all levels
Ø Simplify ER/IR systems so managers can manage
Ø Benchmark/market test all services to ensure
value for money is being achieved
Ø Implement HR Best Practice IT solutions
Ø Implement the Strategic Asset Management Plan.
Ø Sound governance process
|
Council’s services that
are linked to the delivery of these objectives are:
|
Service Area
|
Included in this
service
|
Purpose (what we do)
|
Key Outputs (how we
do it)
|
Service Outcome (why
we do it)
|
|
Corporate, Governance
& Councillor Services
|
Executive Management
|
Ø Provide Executive Management functions in Council
|
Ø Effective leadership and management of the
organisation
|
Ø To be a well governed and customer focussed organisation
that provides leadership within the community
|
|
Governance, Quality &
Corporate Performance
|
Ø Provide support to the organisation in developing
& maintaining high standards of corporate governance
|
Ø Develop and implement corporate governance policies,
procedures, systems and performance standards
|
Ø To ensure that Council meets high governance
standards in its statutory compliance, accountability, efficiency,
transparency & responsiveness and operates in an honest, ethical and
equitable manner
|
|
Ø Review & manage the Council’s integrated
planning and reporting processes
|
Ø Develop and monitor planning & reporting
processes that meet organisational and statutory requirements
|
Ø To achieve and be accountable for the best use of
available resources in delivering the services required by the community
|
|
Ø Manage the development, implementation and ongoing
effectiveness of Council’s business improvement and quality program
|
Ø Develop and implement a continuous business
improvement and quality process
|
Ø To ensure that community and organisational services
are delivered in the most efficient & effective manner
|
|
Audit & Legal
|
Ø Ensure compliance with legislation and code of
conduct around corruption prevention
|
Ø Develop a Corruption Resistance Plan
|
|
|
Councillor Support
|
Ø Support Councillors to fulfil their roles and
responsibilities
Ø Manage Councillor Support Functions.
|
Ø Design and implement an on-going development program
for Councillors e.g. investigate the applicability of Australian Institute of
Company Directors Courses for Councillors, Senior Staff and as a WESROC wide
initiative
|
|
|
Finance Management
|
Financial and Management
Accounting, Procurement, Rates, Insurance & Risk Management
|
Ø Provision of financial management, procurement, risk
management and insurance management services and advice.
|
Ø Budgeting, internal and external financial
reporting, taxation compliance, investments and loans management
Ø Rates management, accounts payable and receivable
Ø Procurement including purchase order processing and
tender management
Ø Insurance claims and policy management
Ø Risk management education, policy and practices.
|
Ø To provide the financial information and advice to
support organisational decision making
Ø To fulfil statutory financial reporting and tax
requirements
Ø To ensure Council’s creditors are paid in an
accurate and timely manner
Ø To ensure that revenue due to Council is collected
in an accurate and timely manner
Ø To procure goods and services that are suitable for
purpose and at the best possible price
Ø To minimise risk to Council by having adequate
insurances and risk management policies and practices in place.
|
|
Ø More effective budgeting and financial management
processes
|
Ø Simplify and shorten the budget process
Ø Introduce clear Finance measures in business planning (KPIs)
Ø Simple bottom line agreed
|
|
|
Ø Whole of life costing and business risk analysis for
all new business initiatives and service changes
|
Ø Establish the guidelines and toolkit for whole of
life costing and business risk
Ø Implement a targeted education
program for managers
Ø Audit the effectiveness of whole of life costing and
business risk guidelines and processes
|
|
|
Ø Prepare and implement a Long Term Financial Position
Plan (LTFP)
|
Ø Develop a credible 10 year Financial baseline and
success model
Ø Implement the LTFP
Ø Connect the LTFP to Strategic Asset Management Plan
and Council’s Community Plan (2025)
|
|
|
Ø Develop a risk management policy, procedures and
assessment tools
|
Ø Implement risk management policy, including
establishment of an Enterprise Risk Management Committee
|
|
|
Ø Conduct risk assessments organisation wide
|
Ø Continue to refine initial risk estimates for high
level risks
|
|
|
Ø Risk analysis results in all business plans and
projects
|
Ø Incorporate a risk analysis section into all
business and project plans. Provide training as required
|
|
|
Ø Review and implement a Business Continuity Framework
(BCF)
|
Ø Review existing documentation
Ø Implement process of bring existing documentation up
to date in consultation with business units.
Ø Develop a policy, procedural framework and
guidelines for BCF (Develop training package)
|
|
|
Ø Develop a procurement plan and procedures
|
Ø Develop a procurement manual for Councillors to
provide guidance on roles and responsibilities
Ø Improve skill sets of those with procurement
responsibilities
|
|
|
Ø Improved contract management and performance
|
Ø Develop a contract register and expiry and review
schedules
Ø Continue to improve the standard conditions of
contract and contract management manual
Ø Training in contract management for key managers
Ø Performance
criteria built into all contracts
Ø Monitor contract performance (including spot audits)
|
|
|
Human Resources
Management
|
Human resources and payroll
|
Ø To provide the HR strategies, policies and services
and build the managerial capability necessary to enable the PCC Delivery Plan
|
Ø HR Strategy 2012 which will deliver PCC goals
(rolling two-year reviews)
Ø Best practice policies that managers understand and
can action (move towards Manager HR Tool Kit)
Ø Efficient/effective OHS claims management - premium
reduction
Ø Workplace audits and injury prevention
Ø L&D solutions that meets cultural, technical and
business needs
Ø Enterprise bargaining and award negotiations (simplify)
Ø Performance management framework including reward
linkages
Ø Cultural change - embed Guiding Principles at all
levels
Ø Improved Management capability to operate without HR
operational advice
Ø Reporting systems and frameworks that meet audience
needs
|
Ø Safe and healthy workplace - fair compensation to
those injured
Ø L&D solutions that drive business outcomes
Ø Growth in leadership capability and succession
Ø Attraction and retention of the best people
Ø Reduction of HR cost
Ø High performance culture and EOC brand
Ø To ensure Council’s staff are paid in an accurate
and timely manner
|
|
Ø Review, develop and Implement a new Strategic HR
Plan for 2009-2017
|
Ø Develop an agreed strategy that addresses Council’s
emerging issues around skills shortages
Ø Research and develop a simple workforce plan
Ø Review current plan and finalise new plan
Ø Implement Plan
|
|
|
Ø Complete Council’s Enterprise Agreement
|
Ø Scope and agree the organisations needs
Ø Implement the project plan to deliver Collective
Agreement
Ø Development of a new salary system
Ø Implement the Enterprise Agreement outcomes
|
|
|
Ø Develop a corporate social responsibility framework
for Council staff
|
Ø Develop a framework and plan for corporate social
responsibility
|
|
|
Ø Develop and support managers to provide effective
leadership and management (refer to 2.2.2 revised Organisational Culture
Program)
|
Ø Scope and deliver a foundation managers course for
new managers
Ø Develop an appropriately tailored Parramanagers
program for level 2, 3 and 4 managers including a mentoring program
|
|
|
Ø Continue to develop the leadership and management
capability of the organisation
|
Ø Evaluate the Organisational Culture Program
Ø Initiate revised Organisational Culture Program
Ø Continue to deliver the Leadership Development
Program
|
|
|
Information
Communication & Technology
|
Information Technology and
Geographic Information Systems
|
Ø Provide IT and GIS services to Council.
|
Ø Problem resolution of IT issues
Ø Provision of GIS and IT support services
Ø Aligning and updating technologies to suit PCC
business needs
|
Ø To ensure business continuity
Ø To assist in enhancing business services within PCC.
|
|
Ø Increase accessibility and availability of
geo-spatial information
|
Ø Geo-spatial information system (GIS) centre to be available on all desktops
|
|
|
Ø Target technology investments to improve efficiency
|
Ø Network Infrastructure and
Security Review findings to be
implemented over two years:
§ Virtualise server farm
§ Migrate to MS Exchange
§ Renew PC contract
§ TRIM – Promotion of use and
cooperative deployment with Records section
§ Design and implementation of
Microsoft SharePoint
§ InfoCouncil – Integration to
TRIM and SharePoint
§ Integration of SharePoint with
TRIM
§ Continued development of Help
Desk Services and Service Level Agreements
§ Upgrade of desktop hardware
and renewal of leasing agreements to reduce on-going costs
§ Preparation of Mid & Long
Term technology strategies
Ø Implement replacement Council Online system
Ø Implement online: Service Request lodgement, job
application, rates payment, & property certificate requests
Ø Review and better integrate Council’s asset
applications in order to support both the Strategic Plan and the Strategic
Asset Management Plan.
|
|
|
|
Customer Relations &
Communication
|
Customer
contact centre, research & consultation, website & business
information services
|
Ø Provide information and service about Council by
customers doing business with us and solving their problems however they
approach us – by mail, web, phone or in person
Ø Create and maintain Parramatta City Council website
and various project websites. Manage Council's business records
Ø Implement Information Management ‘Roadmap’.
|
Ø Advice, referrals, products and services
Ø Records management
Ø PCC Website
Ø Informed decision making, data research (findings,
analysis & reporting)
Ø Prepare Records Management Plan
Ø Review and enhance knowledge management across the
organisation
Ø Implement a more effective and
comprehensive Intranet
Ø Develop options for utilising Wi-Fi in Parramatta
|
Ø Complete satisfaction – first time, every time
Ø Easy & quick access to accurate records
Ø Informed decision making
Ø Accurate, easy to find information about Council
services.
|
|
|
|
Communications and
Marketing
|
Ø Improved communication internally and externally
Ø Inform the community about Council events, services
and programs
Ø Ensure consistent and high quality messaging and
branding to promote Parramatta Council and the City
Ø Comply with legislative reporting requirements
|
Ø Improved mechanism for effectively communicating
with our internal and external stakeholders
Ø Implement the External Communication, Brand and
Marketing Plan, including clarification of roles and responsibilities
Ø Produce the Annual Report
|
Ø Review and redevelop Internal Communications Plan
Ø Implement the revised Internal Communications Plan
Ø Develop a branding blueprint for the city of
Parramatta
|
|
|
Strategic Asset and
Property Management
|
Strategic Asset Management
|
Ø Manage Council’s assets strategically
|
Ø Develop a strategic asset management plan and policy
|
Ø Continue to develop Core Strategic Asset Management
Plan
Ø Complete paper and Business Case
|
|
|
Ø Investigate and implement new models of community
use of facilities.
|
Ø Research and complete draft policy.
|
|
|
|
Ø Increase environmental sustainability of Council’s
assets.
|
Ø Review vision and planning for sustainability
Ø Establish regular monitoring and reporting program
for resource use
Ø Retrofit assets to reduce use of resources
Ø Implement revised waste system across all assets
Ø Engage staff in reducing environmental footprint
Ø Reduce car fleet kilometres travelled and fuel use
Ø Establish sustainability standards for all new
Council developments.
|
|
|
|
Ø Establish systems to reduce environmental risk.
|
Ø Plan for climate change adaptation
Ø Improve erosion, spill control and clean-up controls
and procedures
Ø Involve and train staff in environmental risk
management.
|
|
|
Key Actions for Council
2010-14
|
Service Area
|
2010-11
|
2011-12
|
2012-13
|
2013-14
|
|
Corporate, Governance
& Councillor Services
|
Ø Development and implement top 10 strategic
priorities.
Ø Review & redevelop internal communications plan
|
Ø Councillor elections
Ø Develop and implement top 10 strategic priorities
Ø Review Code of Conduct
Ø Implement policy review program.
|
Ø Develop and implement top 10 strategic priorities
Ø Implement policy review program
Ø Implement revised IPR framework
Ø Develop Councillor induction program
Ø Implement Compliance Plan
|
Ø Develop and implement top 10 strategic priorities
Ø Implement policy review program
Ø Implement Compliance Plan
|
|
Finance Management
|
Ø Implement long term financial plan and gap closing
strategies
Ø Budget 2011-12
Ø Monthly reporting
Ø Quarterly Reviews
Ø Rollout of new financial IT systems.
|
Ø Implement long term financial plan and gap closing
strategies
Ø Budget 2012-13
Ø Monthly reporting
Ø Quarterly Reviews
Ø Further development and value add from new IT
systems
Ø Implement Service Review improvements
Ø Implement improvements to management reporting.
|
Ø Review, update and implement long term financial
plan and gap closing strategies
Ø Budget 2013-14
Ø Monthly reporting
Ø Quarterly Reviews.
|
Ø Review, update and implement long term financial
plan and gap closing strategies
Ø Budget 2014-15
Ø Monthly reporting
Ø Quarterly Reviews.
|
|
Human Resources
Management
|
Ø Develop 2010-12 HR strategic plan
Ø Restructure HR service unit to deliver against plan
Ø Rethink current consultative arrangements - simply
Ø First stage of HR automation (SITSR) - plan for
balance
Ø Performance management system across PCC
Ø Embed Guiding Principles at all levels
Ø Start systemic review of policies and processes
(including candidates for automation)
Ø Benchmark HR services across Sydney councils -
alternate service delivery options
Ø Build managerial capability to operate with less HR
operational support.
|
Ø Develop 2011-13 HR Strategic Plan
Ø Continue leadership development (Good to Great)
Ø Introduce talent management and succession strategy
- "future leaders"
Ø Implement more online learning solutions
Ø New service delivery models (e.g. L&D) and
achieve service delivery economies with other Sydney councils
Ø Provide more in-house training (e.g. Train the
Trainer accreditation for technical training)
Ø Automate more HR processes
Ø Consolidate/improve performance management - lift
focus on poor performance/up or out
Ø Run employee engagement survey (designed in house) -
simple, inexpensive and effective
Ø Reduce cost of HR services (including ER/IR and
level of operational advice).
|
Ø Develop 2012-14 HR Strategic Plan
Ø Introduce first of "manager self service"
modules for HR Services through Chris21 - key processes won't involve HR at
all
Ø All HR policies and processes online and highly
rated by managers (HR Toolkit)
Ø HR business unit advisory roles become strategic
rather than operational as managerial capability grows
Ø Performance management system managed
online/automated end to end
Ø Automate future employee engagement surveys
Ø Reduce cost of general HR services - redirect
resources to L&D, strategic advice and better systems.
|
Ø Develop 2013-15 HR Strategic Plan
Ø Ensure full operational HR responsibility sits with
line managers ("people leaders")
Ø Position HR as providers of strategies, reliable
systems, effective policies, service delivery broker/manager
Ø HR retains role of leadership talent
management/succession advisor - "building future leaders" program
Ø Full automation of HR systems and processes -
paperless - workflows - system controls apply policies
Ø Reduce cost of HR services.
|
|
Information
Communication & Technology
|
Ø Core IT Systems Replacement
Ø IT platform change
Ø Intranet Phase 1
Ø Review of IS and internal practices.
|
Ø Data Centre Disaster Recovery ability
Ø Complete server virtualisation
Ø Replace/upgrade ICT Data Centre network, servers and
storage.
Ø Improve ICT Security governance
Ø Implement GIS online internally within Council
Ø Intranet Phase 2
Ø Core ICT Systems continuous improvement
Ø Implement new Library system
|
Ø Implement Unified Communications
Ø Implement GIS online for general public
Ø Provide new ICT SLAs internal to Council
Ø Desktop upgrade rollout
Ø Core ICT systems continuous improvement
Ø Optimising Wide Area Network
|
Ø Core ICT systems continuous improvement
Ø Optimising backup solution
Ø Application/Desktop virtualisation
Ø Online Data Archiving initiatives
|
|
Customer Relations &
Communication
|
Ø Review of customer channel and cost per service
Ø Digital access to information Plan
Ø Knowledge / Information Management by developing
better search capability
Ø Website redevelopment
Ø Records management plan.
Ø Change Research & Consultation delivery model.
|
Ø Improve customer service via improved Knowledge
Management practices
Ø Enhance website content, expand social media
interaction and increase online service transactions
Ø Implement new on-line Community Voice consultation
model
Ø Implement Records Business Plan
Ø Develop Customer Service Strategy
Ø Review and implement Media Policy
Ø Implement Ethnic Communications Plan
|
Ø Finalise service delivery and relocation planning
for new Civic Place facilities
Ø Implement Customer Service Strategy
Ø Introduce Customer Service Kiosks and self service
options.
Ø Implement Social Media Strategy
Ø Implement phase 2 intranet development
Ø Review and implement a records communication plan
Ø Review Community Engagement Policy
|
Ø Embed new service delivery models in new Council
facilities
|
|
Strategic
Asset and Property Management
|
Ø Asset maintenance reflecting Strategic Asset
Management Plan (SAMP)
Ø Improve SAM systems and integrate
|
Ø Asset maintenance reflecting SAMP
Ø Improve SAM systems and integrate
Ø Upgrade Dundas Community Centre
Ø Review encroachments on Council Lands
Ø Acquire and activate an integrated Property
Management System to manage Council's properties.
|
Ø Asset maintenance reflecting SAMP
Ø Upgrade soccer fields at
Barton Park
Ø Purchase property
for open
space in Granville area
Ø Review encroachments on Council lands
Ø Implement and integrate a mobile data capture system
for asset and property
maintenance and replacement
Ø Develop a strategic asset management plan and policy
with links to LTFP
Ø Develop and implement
Capital Works Framework
and Prioritisation Methodology
and implement new Property
Asset Maintenance and
Capital Program to increase
asset usage
Ø Develop and implement
Service Level Standards and
Service Level Agreements
Ø Establish sustainability standards for all Council
Buildings.
|
Ø Ongoing asset maintenance and
capital replacement to reflecting the SAMP
Ø Purchase property
for open space in Guildford area
Ø Review encroachments on Council lands
Ø Continue to manage the upgrading program of
Council's built assets
|
Key performance measures
|
Resident satisfaction
measures
|
Target
|
Reporting Frequency
|
|
Percentage of residents who
believe Parramatta City Council is well managed
|
Improvement on prior result
|
Annual
|
|
Percentage of resident
rating of the level of services according to overall satisfaction
|
Improvement of prior result
|
Annual
|
|
|
|
|
|
Other measures
|
Target
|
Reporting Frequency
|
|
Percentage of customer
service requests responded to within agreed timeframe
|
Improvement on prior result
|
Quarterly
|
|
Percentage of calls resolved
at first point of contact
|
80%
|
Quarterly
|
|
Tonnes of carbon dioxide
emitted by Council vehicle fleet
|
<2,160
|
Annual
|
|
Kilolitres of water used by
key Council properties
|
91,320
|
Annual
|
|
Tonnes of carbon dioxide
emitted by Council high energy consuming buildings
|
<4,100
|
Annual
|
|
Operating result before
capital income
|
In line with Long Term
Financial Plan
|
Annual
|
|
Capital expenditure on
existing assets/annual depreciation
|
1:1
|
Annual
|
|
Percentage debt service
ratio
|
<8%
|
Annual
|
|
Collection performance –
outstanding rates, charges and fees
|
<4%
|
Annual
|
|
Employee Turnover
|
Reduce
|
Annual
|
|
OHS Premium
|
Reduce 10%
|
Annual
|
Council’s Operational Plan
2012-13
Environment & Infrastructure
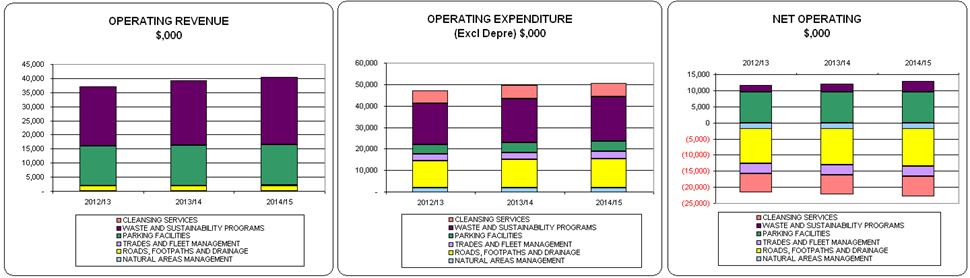
Financial Summary
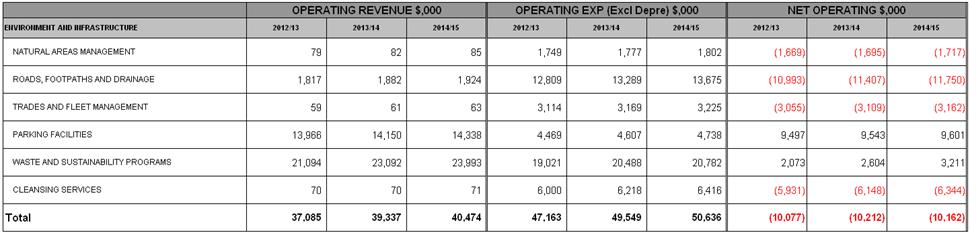
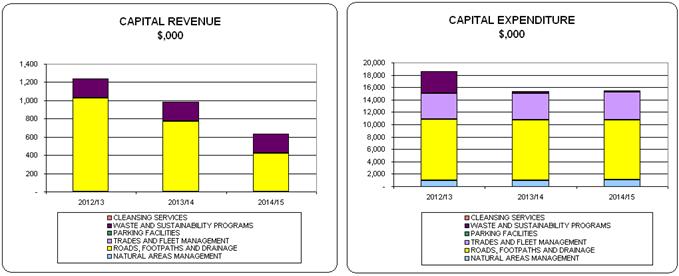
Financial Summary
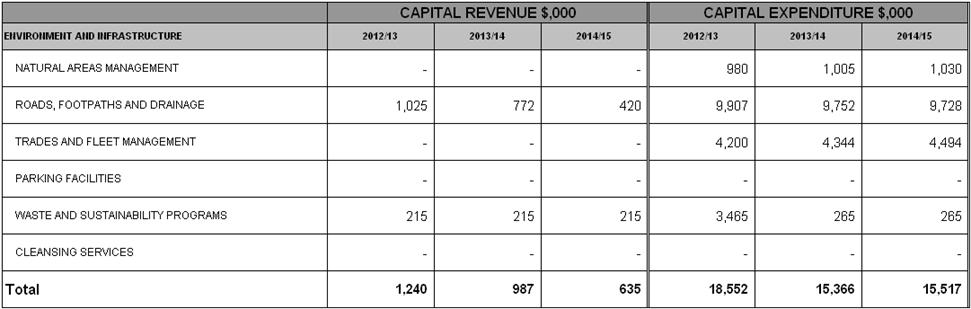
PROJECTS
|
(In $’000)
|
2012/13
|
2013/14
|
2014/15
|
|
ENVIRONMENT AND
INFRASTRUCTURE
|
|
|
|
|
Capital Projects
|
|
|
|
|
NATURAL AREAS MANAGEMENT
|
|
|
|
|
Walking Track Construction
|
110
|
115
|
120
|
|
Restoration of Natural
Areas
|
550
|
560
|
570
|
|
Waterways Restoration
|
320
|
330
|
340
|
|
ROADS, FOOTPATHS AND
DRAINAGE
|
|
|
|
|
Drainage Improvements
|
60
|
70
|
60
|
|
Street Furniture
|
100
|
100
|
100
|
|
Civil Construction Program
|
370
|
385
|
400
|
|
Flood Mitigation Big 7
|
360
|
365
|
370
|
|
Kerb & Gutter Repair
& Maintenance
|
1,000
|
1,000
|
1,100
|
|
Drainage Construction Big 7
|
520
|
530
|
540
|
|
Roads to Recovery
|
372
|
360
|
-
|
|
Pedestrian Access Mobility
Program
|
1,200
|
1,250
|
1,350
|
|
Roads Repair &
Maintenance
|
5,075
|
5,171
|
5,268
|
|
Fishladder Construction
|
300
|
-
|
-
|
|
Water Quality Improvement
Program
|
300
|
300
|
300
|
|
Street Lighting Upgrade
Program
|
120
|
85
|
95
|
|
Bridge Assets - Safety Upgrades
|
130
|
137
|
145
|
|
TRADES AND FLEET
MANAGEMENT
|
|
|
|
|
Light Commercial
Replacement
|
743
|
765
|
788
|
|
Passenger Vehicle
Replacement
|
2,546
|
2,622
|
2,701
|
|
Small Plant Replacement
|
56
|
59
|
62
|
|
Heavy Plant Replacement
|
855
|
898
|
943
|
|
WASTE AND SUSTAINABILITY
PROGRAMS
|
|
|
|
|
Sustainable Water Program
|
50
|
50
|
50
|
|
Waste and Sustainability
Improvement Program - Capital Works
|
215
|
215
|
215
|
|
Paid Parking
|
3,200
|
-
|
-
|
|
|
|
|
|
|
Total For Capital Projects
|
18,552
|
15,366
|
15,517
|
|
|
|
|
|
|
Operating Projects
|
|
|
|
|
NATURAL AREAS MANAGEMENT
|
|
|
|
|
Bushland Resources
Management
|
433
|
435
|
436
|
|
Asbestos Removal
|
53
|
54
|
55
|
|
Protection of Aboriginal
Heritage
|
25
|
25
|
25
|
|
Waterways Litter Reduction
|
53
|
54
|
55
|
|
ROADS, FOOTPATHS AND
DRAINAGE
|
|
|
|
|
Catchment Modelling Roads
|
100
|
100
|
100
|
|
WASTE AND SUSTAINABILITY
PROGRAMS
|
|
|
|
|
Environment Education
Program
|
20
|
20
|
20
|
|
Waste and Sustainability
Improvement Program - General Operating
|
900
|
900
|
900
|
|
|
|
|
|
|
Total For Operating Projects
|
1,584
|
1,588
|
1,591
|
|
|
|
|
|
|
TOTAL FOR ENVIRONMENT AND INFRASTRUCTURE
|
20,137
|
16,954
|
17,108
|
Community & Neighbourhoods
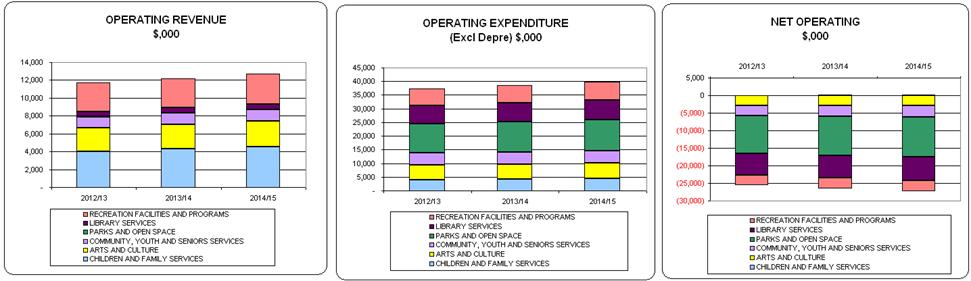
Financial Summary
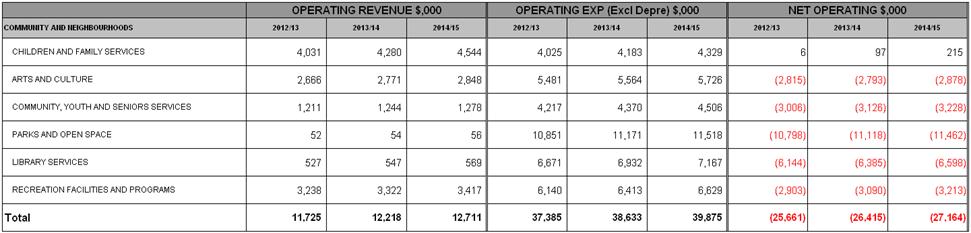
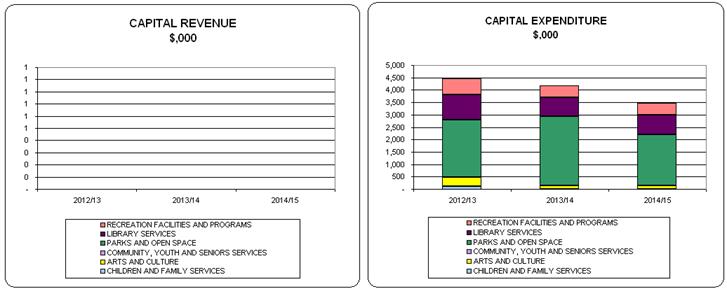
Financial Summary
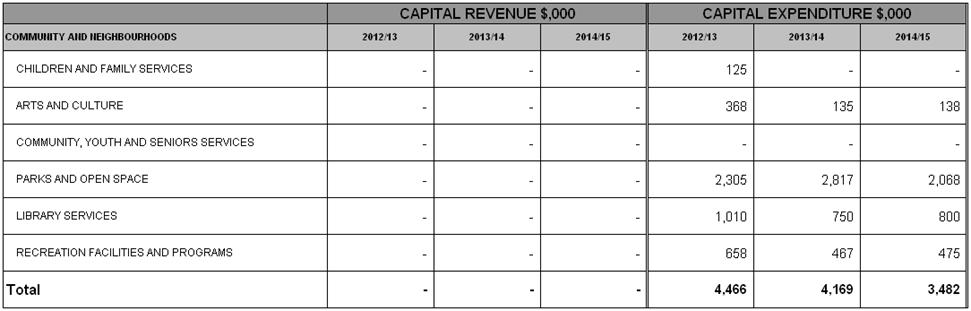
PROJECTS
|
(In $’000)
|
2012/13
|
2013/14
|
2014/15
|
|
COMMUNITY AND
NEIGHBOURHOODS
|
|
|
|
|
Capital Projects
|
|
|
|
|
CHILDREN AND FAMILY
SERVICES
|
|
|
|
|
Frances Fisk Early Learning
Centre Upgrade
|
125
|
-
|
-
|
|
ARTS AND CULTURE
|
|
|
|
|
Riverside Plant &
Equipment
|
133
|
135
|
138
|
|
Riverside Foyer Carpet
|
70
|
-
|
-
|
|
Riverside - Piano's
|
65
|
-
|
-
|
|
Riverside - Digital Signage (Internal)
|
100
|
-
|
-
|
|
PARKS AND OPEN SPACE
|
|
|
|
|
Cultural Parks Program
|
85
|
87
|
88
|
|
Pavilion Program
|
595
|
490
|
490
|
|
Sportsground Program
|
500
|
440
|
440
|
|
Playground Replacement
|
430
|
440
|
450
|
|
Parks Program
|
370
|
380
|
390
|
|
City of Trees
|
185
|
160
|
170
|
|
Parra River
Foreshore Stage 4
|
-
|
480
|
-
|
|
Biodiversity Protection
|
40
|
40
|
40
|
|
Granville Park
Masterplan Implementation
|
-
|
100
|
-
|
|
George Kendall Riverside Park Masterplan Implementation
|
-
|
200
|
-
|
|
Lake Parramatta
Plan of Management
|
100
|
-
|
-
|
|
LIBRARY SERVICES
|
|
|
|
|
Library Resources
|
750
|
750
|
800
|
|
Guildford Branch Library
Upgrade Fit-out
|
260
|
-
|
-
|
|
RECREATION FACILITIES
AND PROGRAMS
|
|
|
|
|
Public Halls & Community
|
318
|
325
|
331
|
|
Recreation Facilities
|
37
|
38
|
39
|
|
Aquatic Facilities Minor
Capital Works
|
53
|
54
|
55
|
|
Hambledon Cottage Minor
Capital
|
50
|
50
|
50
|
|
Major Capital Works
Caroline Chisholm Tennis
|
200
|
-
|
-
|
|
Total For Capital Projects
|
4,466
|
4,169
|
3,482
|
|
|
|
|
|
|
Operating Projects
|
|
|
|
|
ARTS AND CULTURE
|
|
|
|
|
Riverside Theatres 25th
Anniversary Celebration
|
25
|
-
|
-
|
|
PARKS AND OPEN SPACE
|
|
|
|
|
Wildlife Surveys
|
50
|
-
|
-
|
|
Total For Operating Projects
|
75
|
-
|
-
|
|
|
|
|
|
|
TOTAL FOR COMMUNITY AND NEIGHBOURHOODS
|
4,541
|
4,169
|
3,482
|
|
|
|
|
|
Economy & Development
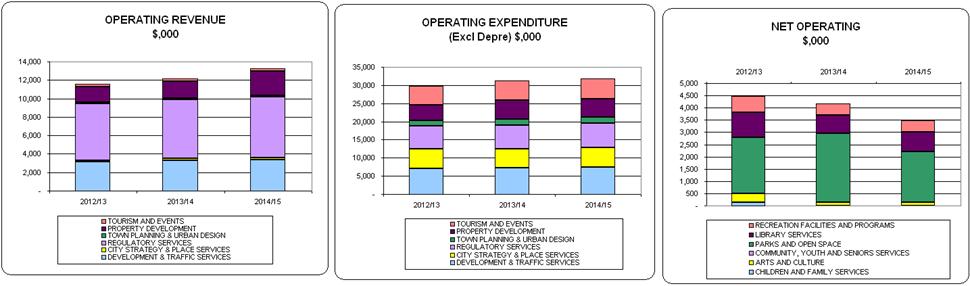
Financial Summary
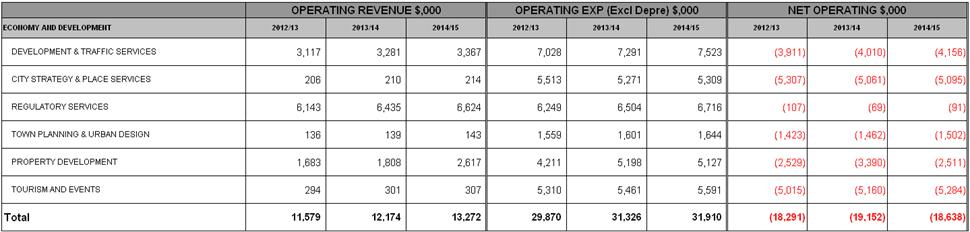
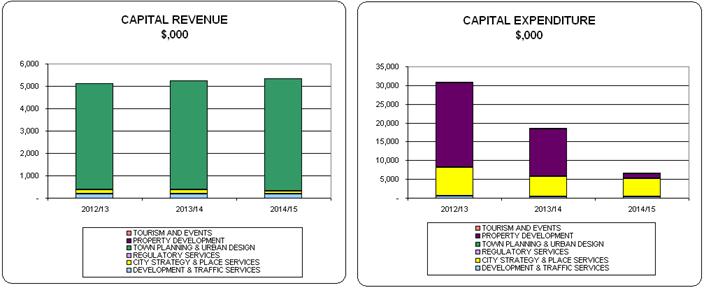
Financial Summary
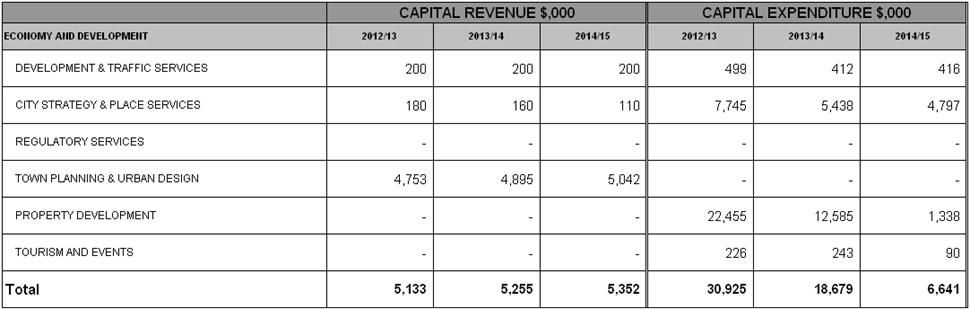
PROJECTS
|
(In $’000)
|
2012/13
|
2013/14
|
2014/15
|
|
ECONOMY AND DEVELOPMENT
|
|
|
|
|
Capital Projects
|
|
|
|
|
DEVELOPMENT &
TRAFFIC SERVICES
|
|
|
|
|
Local Traffic Facilities
|
159
|
162
|
166
|
|
Auslink Blackspot Program
|
200
|
200
|
200
|
|
Rapid Deployment CCTV
Cameras
|
100
|
50
|
50
|
|
Design for the Intersection
Granville
|
40
|
-
|
-
|
|
CITY STRATEGY &
PLACE SERVICES
|
|
|
|
|
City Centre Streetscape
|
1,755
|
1,913
|
1,951
|
|
Neighbourhood Improvement
Program
|
1,486
|
1,515
|
1,546
|
|
Local Bike Facilities
|
160
|
170
|
170
|
|
Foreshore Improvement Plan
|
35
|
40
|
30
|
|
Urgent Works - Arthur
Phillip
|
402
|
100
|
100
|
|
Urgent Works - Caroline
Chisholm
|
462
|
100
|
100
|
|
Urgent Works - Elizabeth
Macarthur
|
412
|
100
|
100
|
|
Urgent Works - Lachlan Macquarie
|
304
|
100
|
100
|
|
Urgent Works - Woodville
|
309
|
100
|
100
|
|
Cycle Route Maintenance
|
50
|
50
|
50
|
|
Contaminated Lands -
Investigation
|
450
|
450
|
-
|
|
Parramatta River
Estuary Management
|
100
|
100
|
-
|
|
Greening the CBD
|
150
|
150
|
-
|
|
Adaptation to Extreme
Weather
|
100
|
50
|
50
|
|
Foreshore Improvement
|
500
|
-
|
-
|
|
Light Rail Feasibility
|
1,000
|
-
|
-
|
|
Improvements to Wentworth Street Car Park
|
-
|
500
|
500
|
|
City Centre Cycle Routes
|
70
|
-
|
-
|
|
PROPERTY DEVELOPMENT
|
|
|
|
|
Civic Place Project
Management
|
875
|
625
|
428
|
|
Strategic Property
Acquisition
|
1,100
|
-
|
-
|
|
Lennox Bridge
Carpark Site
|
100
|
100
|
50
|
|
Operations Centre
|
19,520
|
10,760
|
60
|
|
Phillip Street, Parramatta
Riverbank
|
300
|
300
|
100
|
|
Cowper Street, Granville
|
-
|
50
|
150
|
|
Macquarie Street, Parramatta
|
100
|
100
|
50
|
|
Property Development
(Specific Sites)
|
310
|
650
|
500
|
|
Darcy Street Upgrade
|
150
|
-
|
-
|
|
TOURISM AND EVENTS
|
|
|
|
|
Heritage Centre Building
Minor Capital Works
|
76
|
88
|
90
|
|
Heritage Centre Core
Exhibition Renovation
|
100
|
125
|
-
|
|
Cultural Collection and
Archive Storage
|
50
|
30
|
-
|
|
Total For Capital Projects
|
30,925
|
18,679
|
6,641
|
|
|
|
|
|
|
Operating Projects
|
|
|
|
|
CITY STRATEGY &
PLACE SERVICES
|
|
|
|
|
Economic Development
|
550
|
550
|
550
|
|
Waterways Rehabilitation
Masterplan
|
50
|
50
|
50
|
|
Floodplain Risk Management
Roads
|
120
|
120
|
120
|
|
Rydalmere Technology
Precinct
|
85
|
-
|
-
|
|
Coordinator-Homelessness
|
107
|
97
|
-
|
|
Review of Parra Twenty25
Community Strategic Plan
|
50
|
-
|
-
|
|
Big Ideas Implementation
|
100
|
100
|
100
|
|
Place Activation
|
30
|
-
|
-
|
|
Engage Strategy to Attract
NSW Government to Parramatta
|
150
|
-
|
-
|
|
Crime Prevention - LGA Wide
Crime Prevention
|
50
|
-
|
-
|
|
TOURISM AND EVENTS
|
|
|
|
|
Parramasala
|
300
|
300
|
300
|
|
Cultural Heritage
Collection Conservation and Asset Management
|
10
|
10
|
-
|
|
Total For Operating Projects
|
1,602
|
1,227
|
1,120
|
|
|
|
|
|
|
TOTAL FOR ECONOMY AND DEVELOPMENT
|
32,527
|
19,906
|
7,761
|
Governance & Corporate
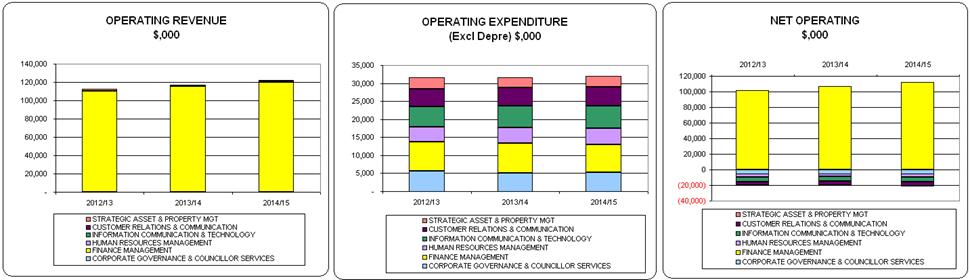
Financial Summary
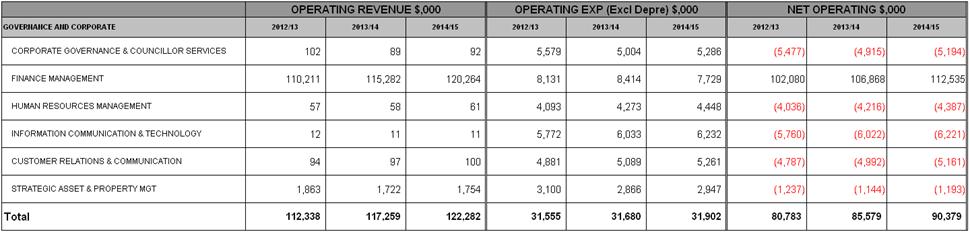
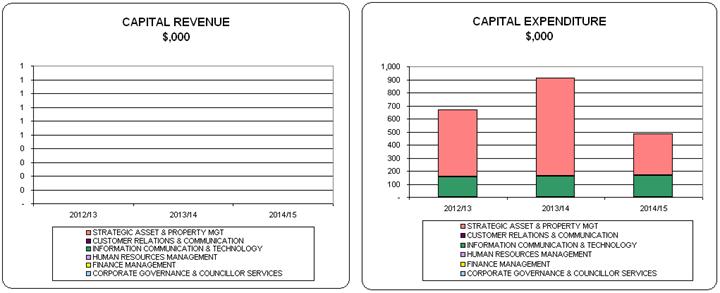
Financial Summary
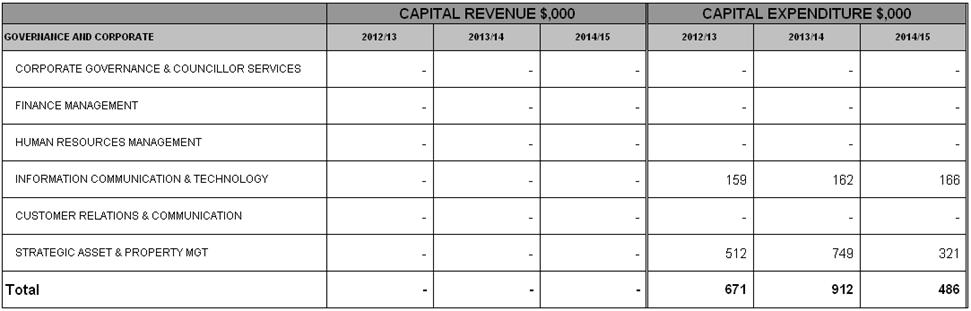
PROJECTS
|
(In $’000)
|
2012/13
|
2013/14
|
2014/15
|
|
GOVERNANCE AND CORPORATE
|
|
|
|
|
Capital Projects
|
|
|
|
|
INFORMATION
COMMUNICATION & TECHNOLOGY
|
|
|
|
|
IT Equipment Replacement
Program
|
159
|
162
|
166
|
|
STRATEGIC ASSET &
PROPERTY MANAGEMENT
|
|
|
|
|
Floodprone Property Acquisition
|
-
|
433
|
-
|
|
Libraries & Child Care
Facility
|
212
|
216
|
221
|
|
Internal Business Unit
Relocations, Refurbishment
|
100
|
100
|
100
|
|
Refurbishment of Wentworth Street Carpark
|
200
|
-
|
-
|
|
|
|
|
|
|
Total For Capital Projects
|
671
|
912
|
486
|
|
|
|
|
|
|
Operating Projects
|
|
|
|
|
INFORMATION
COMMUNICATION & TECHNOLOGY
|
|
|
|
|
IT Business Improvement
eParra
|
57
|
58
|
60
|
|
STRATEGIC ASSET &
PROPERTY MGT
|
|
|
|
|
Fair Value Assets and
Condition Assessments
|
140
|
140
|
140
|
|
|
|
|
|
|
Total For Operating Projects
|
197
|
198
|
200
|
|
|
|
|
|
|
TOTAL FOR GOVERNANCE AND CORPORATE
|
869
|
1,110
|
686
|
|
|
|
|
|
|
Grand Total
|
58,073
|
42,139
|
29,038
|
|
|
|
|
|
FINANCIAL MANAGEMENT
FRAMEWORK
Financial Management
Objectives
The primary objective of Council’s financial
planning is to ensure Council’s continued financial sustainability. A couple of
years ago, the analysis of Council’s financial situation and longer term
financial forecasts showed that there was an unsustainable gap between
operating expenditure and revenue that needed to be addressed. Not addressing
this operational deficit would ultimately jeopardise the adequate funding of
capital expenditure to maintain existing community assets and the additional
expenditure required to provide necessary infrastructure for the future
development of a rapidly growing City. In the past two years, as part of
implementing the integrated planning framework, Council developed a Long term
Financial Plan (LTFP) and Strategic Asset Management Plan (SAMP). As part of
the current year’s budgeting cycle, Council has reviewed and updated the LTFP
to reflect material changes that have eventuated since last year.
One of the key objectives of
the LTFP was to achieve a financially sustainable position by 2014/15 by
rigorously reviewing the way it delivers its services and ensuring that it
derives optimum returns from revenue opportunities, particularly the return on
its property portfolio.
The objective for 2014/15
is to achieve a balanced budget in terms of the operating result - excluding
revenue from capital grants and contributions. Operating income from rates,
charges, fees, grants, contributions and other revenue will be matching
operating expenditure, including interest on loans and depreciation. In
addition to the annual operating result Council needs to focus on some other
key financial parameters. These include the prudent build up and use of reserve
funds (internally and externally restricted), liquidity and unrestricted cash
(reflected in a healthy working capital position), borrowings and debt
servicing, asset replacement and maintenance and new capital project
initiatives.
By focusing on these key
areas and setting targets for each of them over the period of the Delivery
Program, Council aims to improve the financial health of the organisation to a
desirable level that can be sustained in the long term.
To achieve this financial
stability and sustainability of the organisation for the long term, a number of
related financial management objectives have been adopted –
· Delivering an operating surplus before
capital income by 2014/15
· Achieving a debt service ratio of under
8%
· Restricting new loan borrowings and
reducing debt levels
· Managing the growth in employee costs
· Increasing the proportion of non-rates
revenue compared with total revenues
· Maintaining and enhancing the existing
asset base so that current service levels are not compromised
· Undertaking additional capital
expenditure to support Parramatta’s position as Sydney’s second CBD
The achievement of these
objectives will be facilitated by a number of key strategies:
ü Implementing a new industrial relations
framework
ü Comprehensive review of all service
areas both external and internal
ü IT systems replacement
ü Property strategy to optimise returns on
Council’s portfolio
ü Rating strategies
ü Proactive asset
maintenance and replacement
ü Minimising deviations
from budget targets across the organisation
Details of how these
strategies are included in Council’s Long Term Financial Plan. The rating
strategy is outlined in the next section.
Key Financial Management Issues
Restrictions on revenue
Local Government is
significantly restricted in its capacity to raise increased revenue to fund
community services. The primary source of revenue is rates and annual charges.
In 2012/13 Council will derive 62.6% of total operating revenue from ordinary
rates, special rates and annual charges. As noted above, IPART determines the
maximum amount by which rate revenue can increase and this has been fixed at 3.6%
for 2012/13. The average over the last 7 years was 3.2%.
In determining the 2012/13 rate peg, IPART has taken into consideration
growth of 3.4% in the past year in the Local Government Cost Index. IPART has
subtracted a productivity adjustment of 0.2% from the increase in the index and
for this year only added a carbon price advance of 0.4%, to determine a rate
peg amount of 3.6%.
The fees and charges that
Council determines for the supply of goods and services have in most cases been
increased by around 4% to reflect increased costs associated with their supply.
There are a number of fees imposed by Council which are determined by State
Government legislation. In some cases these have not been increased for several
years despite increases to Council in the costs of providing the service.
Increasing costs of
services
While Council’s revenue raising
capacity is limited, it must face increasing costs that in some areas are
outstripping the income needed to fund them. In 2012/13, employee costs account
for 51% of total Council operating expenditure excluding depreciation. In
recent years employee costs had been growing by a rate that exceeded the
increase in revenues from rates, fees and charges. The continuation of this
trend would have been unsustainable. The growth in employee costs was
attributable to an increase in staff numbers as a result of implementing new
services and enhancing some existing services, the provisions of the salary and
wages system that was then operating together with the normal award increases
and significant increases in on-costs such as superannuation.
Action was taken in 2008 to
impose a “freeze” on staff recruitment and following a review of staffing
requirements, 10 positions from the establishment positions were removed
averaging $1 million per annum in savings. In addition, a new industrial
relations framework was negotiated and in late 2010 a new salary and wages
system was implemented. The new arrangements will result in significant savings
in employee costs of approximately $1M per annum.
Council’s current
financial position, like all Councils, has also been adversely impacted by cost
shifting from other levels of government. The Local Government and Shires
Association regularly surveys Councils on the impact of cost shifting and Parramatta can identify around $8 million of annual costs that have been transferred to Council.
Council’s financial
position has also been affected by the impact of a number of Government and
utility charges that have increased at a greater rate than Council’s revenues.
Council’s costs are also forecast to be impacted by the Carbon tax – particularly
energy costs and costs related to the disposal of waste. Council whilst
reviewing its charges for services such as domestic waste which are expected to
be directly impacted by the carbon tax has decided to have a phased approach to
passing on the cost to ratepayers.
Council has also provided
a number of service enhancements in recent years in response to the needs of a
rapidly growing City. These enhancements have covered a range of activities
including extensive development of the arts, tourism promotion, organisational
development, improved customer service and infrastructure maintenance. While
some of those enhancements have been partially funded by grant funds and new
revenue from parking meters, Council has nevertheless had to pick up a cost that
is now part of its core operations.
Debt
levels and servicing costs
Core
Infrastructure Borrowings
In 1996
Council adopted a policy to restrict new annual borrowings so as not to exceed
the amount of principal to be repaid in the same financial year. This had the
effect of ensuring that the level of debt did not increase. In 2000/01 the debt
level under this policy was $29.3 million. Since then Council did not take up
its allocated borrowing under this policy in some years, and the debt under
this policy in June 2013 is forecast to be $20.25M
One-off
Borrowings for Major projects (Big 7)
In 2001/02
Council adopted a one-off strategy to borrow an additional $15 million (in
three instalments of $5 million over three years) to fund major capital projects
referred to as “The Big Seven” major capital items. These loans are being
progressively repaid over a period of 15 years, and will be fully repaid in
2017/18.
Civic
Place Borrowings
Council also
received two special loan allocations totalling $55 million for strategic
property acquisitions in respect of the Civic Place Redevelopment Project – $35
million in the latter part of the 2002/03 financial year and $20 million in
2003/04. These loans were taken up on an interest – only basis, with the
servicing costs being met by income derived from leasing the properties
purchased and interest income from the unexpended loan portfolio. These loans
were renewed in June 2008 on an interest – only basis for a period of five
years. However, the terms of the new loans include the flexibility to make
repayments or redraw on the $55 million facility according to Council’s needs
in relation to Civic Place financial requirements.
As part of the 2011/12 budget, $6.2M has been set aside for reducing
the Civic Place Debt which is due for re-negotiation in June 2013.
In
February 2012, there has been a significant change to the Civic Place project
arrangements, with the contract negotiated in July 2006 with Grocon being ended
following mutual agreement. At the time of updating this plan, Council was yet
to consider alternative options in relation to the Civic Place project.
Therefore it is considered as a prudent strategy, to include any new Civic
Place loans borrowings in June 2013 on a principal and interest expense basis
(current arrangements are on an interest only basis), and the debt servicing
impact of this is included in the financial estimates included in this plan.
One-off
Borrowings – Operations Centre
Council has
plans to develop a new Operations Centre which will replace its current Works
Depot and centralise some other Council functions from their existing
locations. The new development will be fully funded from the sale of existing
properties but short term borrowing of $10M million for up to 12 months will be
required to allow the project to proceed.
Subject to
short term borrowing requirements, Council has determined that it maintain a
debt service ratio (debt service costs/revenue from continuing operations
excluding capital grants & contributions) of less than 8%.
Projected
new borrowings for each year and outstanding debt levels at the end of each
year are shown in the graph below:
Council
proposes borrowing $13.43 million in 2012/13. In accordance with Council’s
borrowing policy, $3.43 million will be borrowed to fund Council’s infrastructure
projects. A special borrowing of $10 million will be made to fund Council’s new
Operations Centre which will replace the current Works Depot and centralise
some other Council functions from their existing locations. The new development
will be funded from the sale of existing properties but a short term interim
borrowing of $10M million will be required to allow the project to proceed.
The provider of the
2012/13 loan program will be determined by seeking quotations from major
lending institutions in accordance with Council’s borrowing policy. All loans
are secured by way of mortgage over Council’s Ordinary Revenue.
The following graph illustrates Council’s
indebtedness and projections of outstanding debt from 2012/13 to 2021/22 under
the base scenario. Council aims for its debt service ratio to remain below 8%
however there are exceptions in the years when loan principals are repaid on
the Civic Place and Operations Centre debt.
Local Infrastructure Renewal Scheme (LIRS)
The NSW Government has recognised that investment in infrastructure is
needed across NSW, and as part of its NSW 2021 State Plan, the Government has
committed to increase expenditure on critical infrastructure.
To achieve this, among other strategies, the NSW Government has committed
to implementing a Local Infrastructure Renewal Scheme (LIRS) which aims to
provide a 4% interest subsidy to assist those councils with legitimate
infrastructure backlogs to cover the cost of borrowing.
Councils' recently developed
Strategic Asset Management Plan (SAMP) reveals that there is a significant gap
between the actual expenditure on existing Council infrastructure and buildings
assets and the amount required to be spent to maintain the existing service level
for the community. This gap is around $6.5M/yr in capital expenditure and
$1M/yr in maintenance expenditure.
In this regard, Council's Long
term Financial Plan has provided for an additional $6M/yr on capital
expenditure and $1M/yr on maintenance expenditure from the 2015/16 year. The
financial plan could not deliver this funding requirement earlier than this
date due to other competing priorities around long term financial
sustainability including achieving a net operating surplus before capital revenue
by 2014/15 which could be sustained in future years and building a healthy
level of reserve funds.
The NSW Government’s
LIRS provides the opportunity for Council’s to implement the SAMP
recommendations in a timely manner starting 2012/13 rather than in 2015/16 as
currently planned due to funding constraints. It is proposed to borrow $20M in 3 annual instalments of $6.5M, $6.5M and $7M respectively The
interest subsidy would add up to $4.85M over a 10 year period (in nominal
terms).
As part of Council’s loan
application, NSW Treasury Corporation will conduct a financial assessment of
Council. Following this exercise, Council
will receive a comprehensive report from Treasury Corporation which would focus
on Council’s key financial risks and performance.
Council’s application for loan funding under the LIRS is subject to
approval by the assessment panel. Therefore the planned expenditure (capital
expenditure and debt servicing) associated with this loan borrowing is subject
to the funding being made available. The financial statements of Council
incorporating impact of the LIRS borrowing are therefore included as a separate
scenario (titled Base plus LIRS borrowing) and would only eventuate if
Council’s LIRS application were to be successful.
Base Plus LIRS Borrowing Scenario
2012/13
BUDGET (Base Scenario)
Operating
and Capital Budget 2012/13
Council has resolved to adopt a budget that delivers an
operating deficit result before capital income of $1,778M. The tables and
graphs below show a summary of the revenue and capital funding sources for the
2012/13 budget.
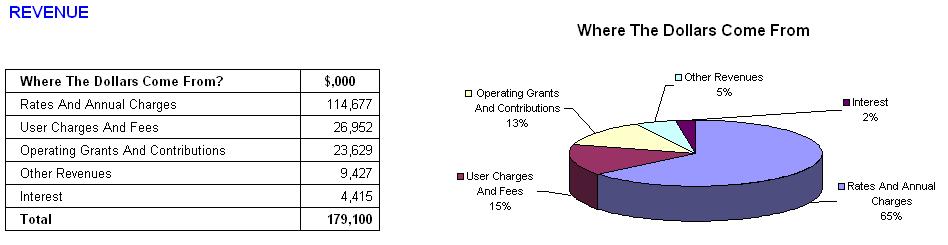
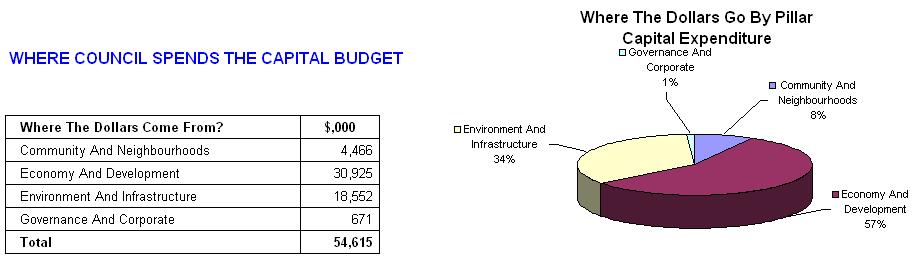


 Council plans to spend
$58.1 million on projects in 2012/13. This money pays for roads, footpaths,
parks, sports fields, nature reserves, waterways and refurbishing our neighbourhood
centres and the CBD. This budget includes projects planned for investment in
the future (Capital Projects, $54.6 million) and new operating initiatives
(Operating Projects, $3.5 million).
Council plans to spend
$58.1 million on projects in 2012/13. This money pays for roads, footpaths,
parks, sports fields, nature reserves, waterways and refurbishing our neighbourhood
centres and the CBD. This budget includes projects planned for investment in
the future (Capital Projects, $54.6 million) and new operating initiatives
(Operating Projects, $3.5 million).
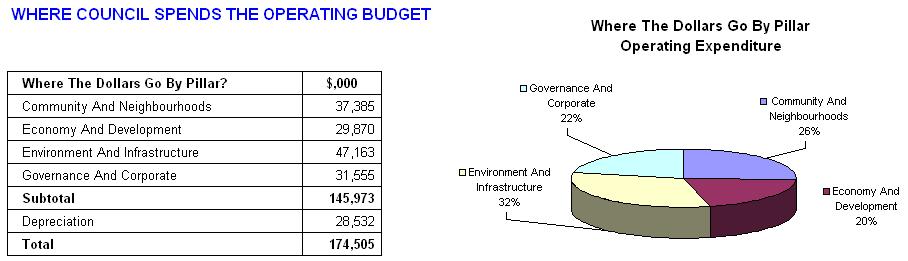
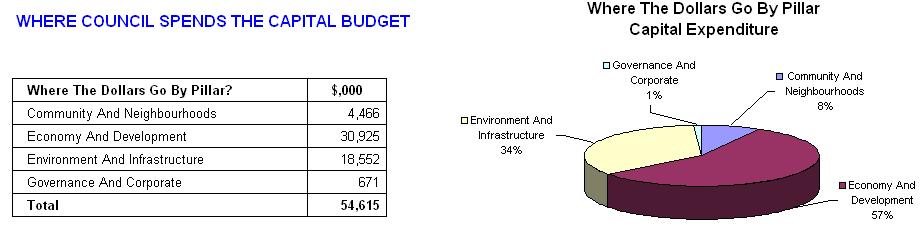
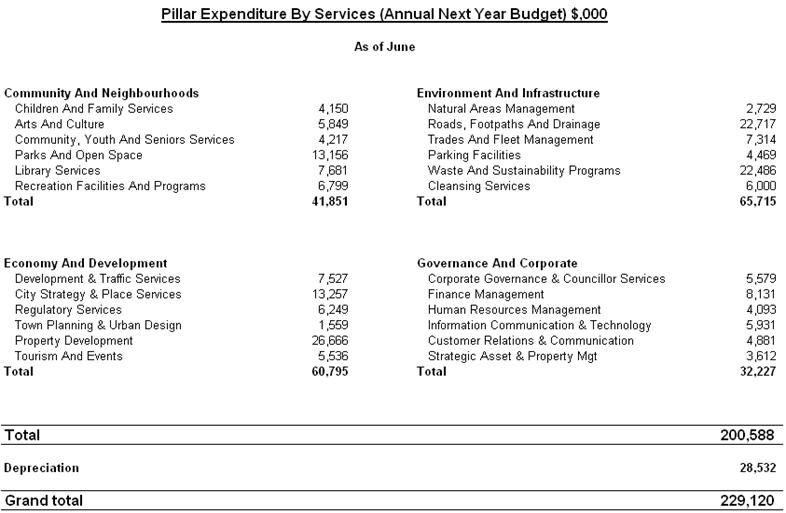
The detailed Operating Statement showing a net
operating result reconciliation to the services result for the period 2012/13
to 2014/15 is shown on pages 75 to 77 of this document.
INCOME
AND EXPENSES ESTIMATES 2012/13 TO 2014/15
Council has developed a 10 year long term
financial plan to generate the following estimates of income and expenses for
2012/13 to 2014/15. The Plan is available as a separate document and includes
forecasts extending to 2021/22.
The forward estimates have as their base
the 2012/13 Budget, with appropriate assumptions where actual financial
information is uncertain or not available. The key assumptions for 2012/13 are
shown below. The assumptions for the years beyond 2012/13 are detailed in
Council’s Long Term Financial Plan.
|
Rates ***
|
3.6%
rate pegging confirmed. Additional special rate variation of 0.7% included in
estimates as approved by IPART. Growth of $400,000
|
|
User
Charges and Fees
|
4%
in general, but some have been increased more to reflect costs, statutory
fees not changed
|
|
Investment
Interest Rate
|
5%
|
|
Annual
Charges
|
10%
domestic waste management. No change to stormwater management charge
|
|
Grants
and Contributions
|
3%
plus specific known additional grants financial assistance grant 7%
|
|
Section
94 Development Contributions
|
3%
|
|
Other
Revenue
|
3%
|
|
Employee
Expenses
|
In
line with salary system provisions and award entitlements
|
|
Materials
and Contracts and Other Expenses
|
3%
|
Note:
Budget and Forward Estimates exclude any impact of asset sales
*** Following
the adoption by Council of the Draft Amended Delivery Program 2010/11 to
2013/14 and Draft Operational Plan 2012/13, Council received advice
from the Department of Local Government in the form of an addendum to the
guidelines for special variation to rates, that IPART in relation to the Carbon Price Advance (to reflect
equitable treatment to all councils) have now made a decision to
allow Council to apply for modifications to Council’s previously
approved special variation percentages by:
· Allowing an additional variation of 0.4% in 2012/13,
and
· Reducing the approved variation in 2013/14 by 0.1%
The tables and statements included in this document do
not reflect the impact of this amendment, as it is subject to IPART
review and approval in June 2012.
Operating result comparison against previous alternatives (Base
Scenario)

Operating Statement (Base Scenario)
|
Description ($000)
|
2012/13
|
2013/14
|
2014/15
|
|
|
|
|
|
|
REVENUE
|
|
|
|
|
RATES AND ANNUAL CHARGES
|
108,172
|
114,307
|
119,200
|
|
SPECIAL RATES
|
6,505
|
6,784
|
7,076
|
|
USER CHARGES AND FEES
|
26,952
|
27,642
|
28,287
|
|
INTEREST
|
4,415
|
4,415
|
4,415
|
|
OTHER REVENUES
|
9,427
|
9,699
|
10,721
|
|
GRANTS – SERVICES
|
13,060
|
13,834
|
14,622
|
|
CONTRIBUTIONS & DONATIONS – SERVICES
|
3,196
|
3,305
|
3,417
|
|
GRANTS - MP PROJECTS - (Operating)
|
980
|
980
|
980
|
|
CONTRIBUTIONS & DONATIONS - MP PROJECTS (Operating)
|
20
|
20
|
20
|
|
TOTAL OPERATING REVENUE
|
172,727
|
180,987
|
188,739
|
|
GRANTS - MP PROJECTS - (Capital)
|
1,608
|
1,333
|
931
|
|
CAPITAL CONTRIBUTIONS AND DONATIONS
|
4,766
|
4,909
|
5,056
|
|
TOTAL CAPITAL REVENUE
|
6,373
|
6,242
|
5.987
|
|
TOTAL REVENUE
|
179,100
|
187,229
|
194,726
|
Operating Statement (Base Scenario) cont’d
|
Description ($000)
|
2012/13
|
2013/14
|
2014/15
|
|
|
|
|
|
|
EXPENSES
|
|
|
|
|
EMPLOYEE COSTS
|
75,140
|
77,900
|
80,614
|
|
BORROWING COSTS
|
4,580
|
5,081
|
4,939
|
|
MATERIALS & CONTRACTS
|
30,687
|
31,340
|
32,244
|
|
OTHER OPERATING EXPENSES
|
32,107
|
33,853
|
33,617
|
|
TOTAL SERVICES EXPENSES
|
142,515
|
148,174
|
151,414
|
|
OPERATING PROJECTS
|
3,459
|
3,013
|
2,911
|
|
DEPRECIATION
|
28,532
|
29,976
|
33,064
|
|
TOTAL OPERATING EXPENSES
|
174,505
|
181,164
|
187,388
|
|
|
|
|
|
|
NET OPERATING RESULT
|
4,595
|
6,066
|
7,338
|
|
|
|
|
|
|
OPERATING RESULT BEFORE CAPITAL REVENUE
|
(1,778)
|
(176)
|
1,351
|
|
|
|
|
|
|
CAPITAL PROJECTS – EXPENDITURE
|
54,615
|
39,126
|
26,127
|
|
CAPITAL PROJECTS FUNDING FROM RESERVES
|
54,615
|
39,126
|
26,127
|
|
NET CAPITAL PROJECTS RESULT
|
0
|
0
|
0
|
Reconciliation of Net Operating Result to Services Result (Base
Scenario)
|
Description ($000)
|
2012/13
|
2013/14
|
2014/15
|
|
SURPLUS/(DEFICIT) FROM CONTINUING OPERATIONS
|
4,595
|
6,066
|
7,338
|
|
PLUS DEPRECIATION
|
28,532
|
29,976
|
33,064
|
|
PLUS OPERATING PROJECTS
|
3,459
|
3,013
|
2,911
|
|
LESS RESTRICTED REVENUE
|
13,878
|
14,026
|
14,063
|
|
LESS LOAN PRINCIPAL PAYMENTS
|
17,105
|
6,036
|
5,955
|
|
LESS TRANSFER TO RESERVE
|
16,869
|
17,021
|
22,323
|
|
PLUS TRANSFER FROM RESERVE TO FUND SERVICES
|
20,304
|
7,864
|
10,302
|
|
SERVICES RESULT
|
9,038
|
9,836
|
11,274
|
BALANCE SHEET
(Base Scenario)
|
Balance Sheet Description
(in $000)
|
2012/13
|
2013/14
|
2014/15
|
|
ASSETS
|
|
|
|
|
Current assets
|
|
|
|
|
Cash and cash equivalents
|
$6,000
|
$6,000
|
$6,000
|
|
Investments
|
$60,580
|
$58,759
|
$73,941
|
|
Receivables
|
$13,043
|
$13,043
|
$13,043
|
|
Inventories
|
$141
|
$141
|
$141
|
|
Other
|
$500
|
$500
|
$500
|
|
Non-current assets
classified as held for resale
|
$0
|
$0
|
$0
|
|
Total current assets
|
$80,264
|
$78,443
|
$93,625
|
|
|
|
|
|
|
Non-current assets
|
|
|
|
|
Receivables
|
$527
|
$527
|
$527
|
|
Investments
|
$27,500
|
$27,500
|
$27,500
|
|
Infrastructure property,
plant & equipment
|
$3,603,339
|
$3,609,698
|
$3,600,145
|
|
Intangible assets
|
$4,288
|
$3,471
|
$2,655
|
|
Investments accounted for
using equity method
|
$2,754
|
$2,754
|
$2,754
|
|
Total non-current assets
|
$3,638,408
|
$3,643,950
|
$3,633,581
|
|
|
|
|
|
|
Total assets
|
$3,718,672
|
$3,722,393
|
$3,727,206
|
|
|
|
|
|
|
LIABILITIES
|
|
|
|
|
Current liabilities
|
|
|
|
|
Payables
|
$14,500
|
$14,500
|
$14,500
|
|
Interest bearing
liabilities
|
$6,036
|
$5,955
|
$6,107
|
|
Provisions
|
$21,121
|
$21,928
|
$22,767
|
|
Total current liabilities
|
$41,656
|
$42,383
|
$43,374
|
|
|
|
|
|
|
Non-current liabilities
|
|
|
|
|
Interest bearing
liabilities
|
$69,603
|
$66,493
|
$62,935
|
|
Provisions
|
$1,003
|
$1,043
|
$1,084
|
|
Total non-current
liabilities
|
$70,606
|
$67,536
|
$64,019
|
|
|
|
|
|
|
Total liabilities
|
$112,262
|
$109,918
|
$107,393
|
|
|
|
|
|
|
Net assets
|
$3,606,410
|
$3,612,475
|
$3,619,813
|
|
|
|
|
|
|
EQUITY
|
|
|
|
|
Retained earnings
|
$883,523
|
$889,588
|
$896,926
|
|
Reserves
|
$2,722,887
|
$2,722,887
|
$2,722,887
|
|
Total equity
|
$3,606,410
|
$3,612,475
|
$3,619,813
|
CASH FLOW STATEMENT (Base Scenario)
|
Budget Cash Flow
Statement (in $'000)
|
2012/13
|
2013/14
|
2014/15
|
|
Cash flows from
operating activities
|
|
|
|
|
Receipts:
|
|
|
|
|
Rates and annual charges
|
114,677
|
121,091
|
126,277
|
|
User charges and fees
|
26,952
|
27,642
|
28,287
|
|
Investment revenue and
interest
|
4,415
|
4,415
|
4,415
|
|
Grants and contributions
|
23,630
|
24,381
|
25,026
|
|
Other
|
9,427
|
9,699
|
10,721
|
|
Payments:
|
|
|
|
|
Employee benefits and
on-costs
|
(74,326)
|
(77,053)
|
(79,733)
|
|
Materials and contracts
|
(32,417)
|
(32,847)
|
(33,699)
|
|
Borrowing costs
|
(4,580)
|
(5,081)
|
(4,939)
|
|
Other
|
(33,837)
|
(35,360)
|
(35,073)
|
|
Net cash provided (or
used in) operating activities
|
33,942
|
36,888
|
41,283
|
|
|
|
|
|
|
Cash flows from
investing activities
|
|
|
|
|
Receipts:
|
|
|
|
|
Sale of investments
|
0
|
1,821
|
0
|
|
Sale of real estate
assets
|
43,000
|
1,745
|
1,530
|
|
Sale of infrastructure,
property, plant and equipment
|
1,824
|
1,863
|
1,902
|
|
Payments:
|
|
|
|
|
Purchase of investments
|
(20,541)
|
0
|
(15,182)
|
|
Purchase of real estate
|
|
|
|
|
Purchase of
infrastructure, property, plant and equipment
|
(54,615)
|
(39,126)
|
(26,127)
|
|
Net cash provided by (or
used in) investing activities
|
(30,332)
|
(33,697)
|
(37,877)
|
|
|
|
|
|
|
Cash flows from
financing activities
|
|
|
|
|
Receipts:
|
|
|
|
|
Borrowings and advances
|
13,495
|
2,845
|
2,549
|
|
Payments:
|
|
|
|
|
Borrowings and advances
|
(17,105)
|
(6,036)
|
(5,955)
|
|
Net cash provided by (or
used in) financing activities
|
(3,610)
|
(3,191)
|
(3,406)
|
|
|
|
|
|
|
Net increase/(decrease)
in cash and cash equivalents
|
0
|
0
|
0
|
|
Cash and cash
equivalents at beginning of reporting period
|
6,000
|
6,000
|
6,000
|
|
Cash and cash
equivalents at end of reporting period
|
6,000
|
6,000
|
6,000
|
|
** Increase/Decrease
|
0
|
0
|
0
|
RESERVES SUMMARY (Base
Scenario)
|
Transfers to and From Reserves (in $'000)
|
2012/13
|
2013/14
|
2014/15
|
|
|
|
|
|
|
External Reserves
|
|
|
|
|
|
|
|
|
|
Loans
|
|
|
|
|
Opening Balance
|
$444
|
$477
|
$521
|
|
Plus Transfers to Reserve
|
$13,495
|
$2,845
|
$2,549
|
|
Less Transfers from Reserve
|
($13,462)
|
($2,801)
|
($2,502)
|
|
Closing Balance
|
$477
|
$521
|
$568
|
|
|
|
|
|
|
Grants and Contributions
|
|
|
|
|
Opening Balance
|
$1,645
|
$1,798
|
$1,811
|
|
Plus Transfers to Reserve
|
$3,309
|
$3,069
|
$2,705
|
|
Less Transfers from Reserve
|
($3,156)
|
($3,056)
|
($2,691)
|
|
Closing Balance
|
$1,798
|
$1,811
|
$1,825
|
|
|
|
|
|
|
Section 94 Contributions
|
|
|
|
|
Opening Balance
|
$22,341
|
$24,651
|
$28,280
|
|
Plus Transfers to Reserve
|
$5,994
|
$6,186
|
$6,385
|
|
Less Transfers from Reserve
|
($3,684)
|
($2,557)
|
($2,475)
|
|
Closing Balance
|
$24,651
|
$28,280
|
$32,190
|
|
|
|
|
|
|
Domestic Waste
|
|
|
|
|
Opening Balance
|
$4,220
|
$3,919
|
$4,011
|
|
Plus Transfers to Reserve
|
$1,899
|
$2,392
|
$2,959
|
|
Less Transfers from Reserve
|
($2,200)
|
($2,300)
|
($2,400)
|
|
Closing Balance
|
$3,919
|
$4,011
|
$4,570
|
|
|
|
|
|
|
Open Space Special Rate
|
|
|
|
|
Opening Balance
|
$786
|
$473
|
$93
|
|
Plus Transfers to Reserve
|
$2,248
|
$2,345
|
$2,446
|
|
Less Transfers from Reserve
|
($2,561)
|
($2,725)
|
($1,769)
|
|
Closing Balance
|
$473
|
$93
|
$770
|
|
|
|
|
|
|
Suburban Infrastructure
Special Rate
|
|
|
|
|
Opening Balance
|
$1,025
|
$1,034
|
$1,434
|
|
Plus Transfers to Reserve
|
$1,750
|
$1,824
|
$1,903
|
|
Less Transfers from Reserve
|
($1,741)
|
($1,424)
|
($1,406)
|
|
Closing Balance
|
$1,034
|
$1,434
|
$1,931
|
|
|
|
|
|
|
CBD Infrastructure
Special Rate
|
|
|
|
|
Opening Balance
|
$4,510
|
$4,712
|
$4,700
|
|
Plus Transfers to Reserve
|
$2,223
|
$2,317
|
$2,416
|
|
Less Transfers from Reserve
|
($2,021)
|
($2,329)
|
($1,951)
|
|
Closing Balance
|
$4,712
|
$4,700
|
$5,165
|
|
|
|
|
|
|
Economic Development
Special Rate
|
|
|
|
|
Opening Balance
|
$259
|
$252
|
$333
|
|
Plus Transfers to Reserve
|
$692
|
$722
|
$753
|
|
Less Transfers from Reserve
|
($699)
|
($641)
|
($644)
|
|
Closing Balance
|
$252
|
$333
|
$442
|
|
|
|
|
|
|
Stormwater Levy
|
|
|
|
|
Opening Balance
|
$392
|
$404
|
$365
|
|
Plus Transfers to Reserve
|
$1,382
|
$1,431
|
$1,481
|
|
Less Transfers from Reserve
|
($1,370)
|
($1,470)
|
($1,470)
|
|
Closing Balance
|
$404
|
$365
|
$376
|
|
Total External
Reserves
|
$37,720
|
$41,548
|
$47,837
|
|
Internal Reserves
|
|
|
|
|
|
|
|
|
|
Plant Replacement
|
|
|
|
|
Opening Balance
|
$1,994
|
$2,093
|
$2,185
|
|
Plus Transfers to Reserve
|
$4,299
|
$4,436
|
$4,578
|
|
Less Transfers from Reserve
|
($4,200)
|
($4,344)
|
($4,494)
|
|
Closing Balance
|
$2,093
|
$2,185
|
$2,269
|
|
|
|
|
|
|
Employee Leave
Entitlements
|
|
|
|
|
Opening Balance
|
$1,490
|
$2,418
|
$2,418
|
|
Plus Transfers to Reserve
|
$928
|
$0
|
$1,581
|
|
Less Transfers from Reserve
|
$0
|
$0
|
$0
|
|
Closing Balance
|
$2,418
|
$2,418
|
$3,999
|
|
|
|
|
|
|
Property
|
|
|
|
|
Opening Balance
|
$1,015
|
$1,217
|
$1,419
|
|
Plus Transfers to Reserve
|
$202
|
$202
|
$266
|
|
Less Transfers from Reserve
|
$0
|
$0
|
$0
|
|
Closing Balance
|
$1,217
|
$1,419
|
$1,685
|
|
|
|
|
|
|
Property Development and
Investment
|
|
|
|
|
Opening Balance
|
$7,521
|
$29,644
|
$18,824
|
|
Plus Transfers to Reserve
|
$43,000
|
$1,745
|
$1,530
|
|
Less Transfers from Reserve
|
($20,877)
|
($12,565)
|
($1,539)
|
|
Closing Balance
|
$29,644
|
$18,824
|
$18,815
|
|
|
|
|
|
|
Civic Place
Redevelopment
|
|
|
|
|
Opening Balance
|
$451
|
$51
|
$51
|
|
Plus Transfers to Reserve
|
$0
|
$0
|
$0
|
|
Less Transfers from Reserve
|
($400)
|
$0
|
$0
|
|
Closing Balance
|
$51
|
$51
|
$51
|
|
|
|
|
|
|
Computer
|
|
|
|
|
Opening Balance
|
$373
|
$373
|
$373
|
|
Plus Transfers to Reserve
|
$928
|
$1,401
|
$3,638
|
|
Less Transfers from Reserve
|
($928)
|
($1,401)
|
($3,638)
|
|
Closing Balance
|
$373
|
$373
|
$373
|
|
|
|
|
|
|
Insurance
|
|
|
|
|
Opening Balance
|
$527
|
$527
|
$527
|
|
Plus Transfers to Reserve
|
$0
|
$0
|
$500
|
|
Less Transfers from Reserve
|
$0
|
$0
|
$0
|
|
Closing Balance
|
$527
|
$527
|
$1,027
|
|
|
|
|
|
|
Open Space
|
|
|
|
|
Opening Balance
|
$429
|
$504
|
$582
|
|
Plus Transfers to Reserve
|
$75
|
$78
|
$81
|
|
Less Transfers from Reserve
|
$0
|
$0
|
$0
|
|
Closing Balance
|
$504
|
$582
|
$663
|
|
|
|
|
|
|
Council Election
|
|
|
|
|
Opening Balance
|
$462
|
$3
|
$149
|
|
Plus Transfers to Reserve
|
$141
|
$146
|
$152
|
|
Less Transfers from Reserve
|
($600)
|
$0
|
$0
|
|
Closing Balance
|
$3
|
$149
|
$301
|
|
|
|
|
|
|
Parking Meters
|
|
|
|
|
Opening Balance
|
$3,497
|
$1,142
|
$1,920
|
|
Plus Transfers to Reserve
|
$3,483
|
$3,438
|
$3,399
|
|
Less Transfers from Reserve
|
($5,838)
|
($2,660)
|
($2,792)
|
|
Closing Balance
|
$1,142
|
$1,920
|
$2,527
|
|
|
|
|
|
|
Prior Year Revenue
|
|
|
|
|
Opening Balance
|
$4,550
|
$490
|
$490
|
|
Plus Transfers to Reserve
|
$0
|
$0
|
$0
|
|
Less Transfers from Reserve
|
($4,060)
|
$0
|
$0
|
|
Closing Balance
|
$490
|
$490
|
$490
|
|
|
|
|
|
|
Asset Renewal
|
|
|
|
|
Opening Balance
|
$3,596
|
$6,466
|
$7,829
|
|
Plus Transfers to Reserve
|
$3,000
|
$1,500
|
$1,500
|
|
Less Transfers from Reserve
|
($130)
|
($137)
|
($145)
|
|
Closing Balance
|
$6,466
|
$7,829
|
$9,184
|
|
|
|
|
|
|
Other Reserves
|
|
|
|
|
Opening Balance
|
$3,744
|
$2,332
|
$3,709
|
|
Plus Transfers to Reserve
|
$0
|
$1,401
|
$1,525
|
|
Less Transfers from Reserve
|
($1,412)
|
($24)
|
($24)
|
|
Closing Balance
|
$2,332
|
$3,709
|
$5,210
|
|
Total Internal
Reserves
|
$47,260
|
$40,476
|
$46,594
|
|
|
|
|
|
|
Total External Reserves
|
$37,720
|
$41,548
|
$47,837
|
|
Total Internal Reserves
|
$47,260
|
$40,476
|
$46,594
|
|
Total Reserves
|
$84,980
|
$82,024
|
$94,431
|
Operating result comparison against previous alternatives (Base Plus
LIRS Borrowing Scenario)
Operating Statement (Base + LRIS Borrowing Scenario)
|
Description ($000)
|
2012/13
|
2013/14
|
2014/15
|
|
|
|
|
|
|
REVENUE
|
|
|
|
|
RATES AND ANNUAL CHARGES
|
108,172
|
114,307
|
119,200
|
|
SPECIAL RATES
|
6,505
|
6,784
|
7,076
|
|
USER CHARGES AND FEES
|
26,952
|
27,642
|
28,287
|
|
INTEREST
|
4,415
|
4,415
|
4,415
|
|
OTHER REVENUES
|
9,427
|
9,699
|
10,721
|
|
GRANTS – SERVICES
|
13,060
|
13,834
|
14,622
|
|
CONTRIBUTIONS & DONATIONS – SERVICES
|
3,196
|
3,305
|
3,417
|
|
GRANTS - MP PROJECTS - (Operating)
|
980
|
980
|
980
|
|
CONTRIBUTIONS & DONATIONS - MP PROJECTS (Operating)
|
20
|
20
|
20
|
|
TOTAL OPERATING REVENUE
|
172,727
|
180,987
|
188,739
|
|
GRANTS - MP PROJECTS - (Capital)
|
1,608
|
1,333
|
931
|
|
CAPITAL CONTRIBUTIONS AND DONATIONS
|
4,766
|
4,909
|
5,056
|
|
TOTAL CAPITAL REVENUE
|
6,373
|
6,242
|
5.987
|
|
TOTAL REVENUE
|
179,100
|
187,229
|
194,726
|
Operating Statement (Base + LRIS Borrowing Scenario)
cont’d
|
Description ($000)
|
2012/13
|
2013/14
|
2014/15
|
|
|
|
|
|
|
EXPENSES
|
|
|
|
|
EMPLOYEE COSTS
|
75,140
|
77,900
|
80,614
|
|
BORROWING COSTS
|
4,580
|
5,235
|
5,257
|
|
MATERIALS & CONTRACTS
|
30,687
|
31,340
|
32,244
|
|
OTHER OPERATING EXPENSES
|
32,107
|
33,853
|
33,617
|
|
TOTAL SERVICES EXPENSES
|
142,515
|
148,328
|
151,732
|
|
OPERATING PROJECTS
|
3,459
|
3,013
|
2,911
|
|
DEPRECIATION
|
28,532
|
29,976
|
33,064
|
|
TOTAL OPERATING EXPENSES
|
174,505
|
181,318
|
187,706
|
|
|
|
|
|
|
NET OPERATING RESULT
|
4,595
|
5,912
|
7,020
|
|
|
|
|
|
|
OPERATING RESULT BEFORE CAPITAL REVENUE
|
(1,778)
|
(330)
|
1,033
|
|
|
|
|
|
|
CAPITAL PROJECTS – EXPENDITURE
|
61,115
|
45,626
|
33,127
|
|
CAPITAL PROJECTS FUNDING FROM RESERVES
|
61,115
|
45,626
|
33,127
|
|
NET CAPITAL PROJECTS RESULT
|
0
|
0
|
0
|
Reconciliation of Net Operating Result to Services Result (Base + LRIS
Borrowing Scenario)
|
Description ($000)
|
2012/13
|
2013/14
|
2014/15
|
|
SURPLUS/(DEFICIT) FROM CONTINUING OPERATIONS
|
4,595
|
5,912
|
7,020
|
|
PLUS DEPRECIATION
|
28,532
|
29,976
|
33,064
|
|
PLUS OPERATING PROJECTS
|
3,459
|
3,013
|
2,911
|
|
LESS RESTRICTED REVENUE
|
13,878
|
14,026
|
14,063
|
|
LESS LOAN PRINCIPAL PAYMENTS
|
17,105
|
6,602
|
7,105
|
|
LESS TRANSFER TO RESERVE
|
16,869
|
17,021
|
22,323
|
|
PLUS TRANSFER FROM RESERVE TO FUND SERVICES
|
20,304
|
8,621
|
11,816
|
|
SERVICES RESULT
|
9,038
|
9,873
|
11,320
|
BALANCE SHEET
(Base + LIRS Borrowing Scenario)
|
Balance Sheet Description
(in $000)
|
2012/13
|
2013/14
|
2014/15
|
|
ASSETS
|
|
|
|
|
Current assets
|
|
|
|
|
Cash and cash equivalents
|
$6,000
|
$6,000
|
$6,000
|
|
Investments
|
$60,581
|
$58,040
|
$71,754
|
|
Receivables
|
$13,043
|
$13,043
|
$13,043
|
|
Inventories
|
$141
|
$141
|
$141
|
|
Other
|
$500
|
$500
|
$500
|
|
Non-current assets
classified as held for resale
|
$0
|
$0
|
$0
|
|
Total current assets
|
$80,265
|
$77,724
|
$91,438
|
|
|
|
|
|
|
Non-current assets
|
|
|
|
|
Receivables
|
$527
|
$527
|
$527
|
|
Investments
|
$27,500
|
$27,500
|
$27,500
|
|
Infrastructure property,
plant & equipment
|
$3,609,839
|
$3,622,698
|
$3,620,145
|
|
Intangible assets
|
$4,288
|
$3,471
|
$2,655
|
|
Investments accounted for
using equity method
|
$2,754
|
$2,754
|
$2,754
|
|
Total non-current assets
|
$3,644,908
|
$3,656,950
|
$3,653,581
|
|
|
|
|
|
|
Total assets
|
$3,725,173
|
$3,734,674
|
$3,745,019
|
|
|
|
|
|
|
LIABILITIES
|
|
|
|
|
Current liabilities
|
|
|
|
|
Payables
|
$14,500
|
$14,500
|
$14,500
|
|
Interest bearing
liabilities
|
$6,602
|
$7,105
|
$7,902
|
|
Provisions
|
$21,121
|
$21,928
|
$22,767
|
|
Total current liabilities
|
$42,223
|
$43,533
|
$45,169
|
|
|
|
|
|
|
Non-current liabilities
|
|
|
|
|
Interest bearing
liabilities
|
$75,538
|
$77,778
|
$79,425
|
|
Provisions
|
$1,003
|
$1,043
|
$1,084
|
|
Total non-current
liabilities
|
$76,540
|
$78,820
|
$80,509
|
|
|
|
|
|
|
Total liabilities
|
$118,763
|
$122,353
|
$125,678
|
|
|
|
|
|
|
Net assets
|
$3,606,410
|
$3,612,320
|
$3,619,341
|
|
|
|
|
|
|
EQUITY
|
|
|
|
|
Retained earnings
|
$883,523
|
$889,433
|
$896,454
|
|
Reserves
|
$2,722,887
|
$2,722,887
|
$2,722,887
|
|
Total equity
|
$3,606,410
|
$3,612,320
|
$3,619,341
|
CASH FLOW STATEMENT (Base + LIRS Borrowing
Scenario)
|
Budget Cash Flow
Statement (in $'000)
|
2012/13
|
2013/14
|
2014/15
|
|
Cash flows from
operating activities
|
|
|
|
|
Receipts:
|
|
|
|
|
Rates and annual charges
|
114,677
|
121,091
|
126,277
|
|
User charges and fees
|
26,952
|
27,642
|
28,287
|
|
Investment revenue and
interest
|
4,415
|
4,415
|
4,415
|
|
Grants and contributions
|
23,630
|
24,381
|
25,026
|
|
Other
|
9,427
|
9,699
|
10,721
|
|
Payments:
|
|
|
|
|
Employee benefits and
on-costs
|
(74,326)
|
(77,053)
|
(79,733)
|
|
Materials and contracts
|
(32,417)
|
(32,847)
|
(33,699)
|
|
Borrowing costs
|
(4,580)
|
(5,235)
|
(5,257)
|
|
Other
|
(33,837)
|
(35,360)
|
(35,073)
|
|
Net cash provided (or
used in) operating activities
|
33,942
|
36,734
|
40,965
|
|
|
|
|
|
|
Cash flows from
investing activities
|
|
|
|
|
Receipts:
|
|
|
|
|
Sale of investments
|
0
|
2,541
|
0
|
|
Sale of real estate
assets
|
43,000
|
1,745
|
1,530
|
|
Sale of infrastructure,
property, plant and equipment
|
1,824
|
1,863
|
1,902
|
|
Payments:
|
|
|
|
|
Purchase of investments
|
(20,541)
|
0
|
(13,714)
|
|
Purchase of real estate
|
|
|
|
|
Purchase of
infrastructure, property, plant and equipment
|
(61,115)
|
(45,626)
|
(33,127)
|
|
Net cash provided by (or
used in) investing activities
|
(36,832)
|
(39,477)
|
(43,409)
|
|
|
|
|
|
|
Cash flows from
financing activities
|
|
|
|
|
Receipts:
|
|
|
|
|
Borrowings and advances
|
19,995
|
9,345
|
9,549
|
|
Payments:
|
|
|
|
|
Borrowings and advances
|
(17,105)
|
(6,602)
|
(7,105)
|
|
Net cash provided by (or
used in) financing activities
|
2,890
|
2,743
|
2,444
|
|
|
|
|
|
|
Net increase/(decrease)
in cash and cash equivalents
|
0
|
0
|
0
|
|
Cash and cash
equivalents at beginning of reporting period
|
6,000
|
6,000
|
6,000
|
|
Cash and cash
equivalents at end of reporting period
|
6,000
|
6,000
|
6,000
|
|
** Increase/Decrease
|
0
|
0
|
0
|
RATES,
FEES AND CHARGES
Ordinary
and Special Rates Income
The Independent Pricing &
Regulatory Tribunal determines the maximum amount by which NSW Councils may
increase their general rate income above the general income for the previous
year. For the 2012/13 financial year IPART has announced that the increase is
3.6%. IPART has approved Council for a special variation to rates in 2012/13 of
0.7% in addition to the rate pegging increase.
Land
Valuation
In 2012/13 Council will be using
land values as at 1 July 2010 to calculate rates. Valuations are
determined by the NSW Government’s Valuer General.
Ordinary
Rates
Rates are determined on the
categorisation of land. Council’s ordinary rating structure consists of two
categories – residential and business rates. These categories in turn have
sub-categories determined by the location of the land as detailed in the tables
on the following pages.
Special
Rates
The Local Government Act provides
that a council may make a special rate for or towards meeting the cost of any
works, services, facilities or activities provided or undertaken, or proposed
to be provided or undertaken, by the Council within the whole or any part of
the Council’s area. In 2012/13 Council proposes to make a number of special
rates and the details of these rates and the works and services that the
special rates will fund are included in the following pages.
It is proposed that the use of
the special rates levied for Infrastructure include maintenance and/or
operational phases of approved special rate projects not just capital upfront
expenditure, as part of a prudent lifecycle approach to asset management.
Pensioner
Rebates
All NSW
councils give a mandatory rebate of up to $250 to eligible pensioners.
Parramatta City Council is one of the few Councils that grants an additional
voluntary rebate of up to $100 to eligible pensioners. Funding of around
$670,000 is required for this additional voluntary rebate.
Council proposes to make the
following Ordinary and Special Rates in 2012/13 following IPART’s approval for
the special variation noted earlier.
Ordinary Rates
|
RATE
|
# of Assessments
|
Minimum
Rate ($)
|
Ad
Valorem Rate in ($)
|
Valuation
(1
July 2010)
|
Notional
Yield
($)
|
|
Residential*
|
32,230
|
|
.00264836
|
11,703,327,143
|
30,994,628
|
|
Residential*
|
25,143
|
580.60
|
|
2,197,361,557
|
14,570,438
|
|
Subtotal
|
57,373
|
|
|
|
45,565,066
|
|
Business
General
|
1,170
|
|
0.01217397
|
501,187,919
|
6,101,446
|
|
Business
General
|
178
|
591.90
|
|
5,976,137
|
105,359
|
|
Business
CBD
|
1254
|
|
0.02162403
|
834,549,300
|
18,046,318
|
|
Business
CBD
|
348
|
591.90
|
|
4,978,872
|
205,982
|
|
Business
CBD#2
|
9
|
|
0.03560188
|
76,196,000
|
2,712,721
|
|
Business
ICA
|
1222
|
|
0.01307191
|
1,238,838,016
|
16,193,978
|
|
Business
ICA
|
92
|
591.90
|
|
2,483,924
|
54,455
|
|
Business
ICA#2
|
1
|
|
0.01307191
|
53,000,000
|
692,811
|
|
Subtotal
|
4,274
|
|
|
|
44,113,070
|
|
Total
Ordinary Rates
|
61,647
|
|
|
|
89,678,135
|
Special Rates
|
PURPOSE
|
# of Assessments
|
Base
Amount ($)
|
Ad
Valorem Rate in ($)
|
Valuation
(1
July 2010)
|
Notional
Yield ($)
|
|
Open Space Acquisition & Embellishment
|
61,531
|
|
0.00006253
|
16,617,898,868
|
1,039,090
|
|
Open
Space Acquisition & Embellishment
|
61,531
|
17.01
|
|
|
1,046,724
|
|
Infrastructure*
|
59,928
|
|
0.00007793
|
15,701,703,696
|
1,250,177
|
|
Infrastructure*
|
59,928
|
6.94
|
|
|
433,135
|
|
CBD
Infrastructure
|
1,611
|
|
.00209047
|
915,898,612
|
1,914,663
|
|
Economic
Development
|
2,595
|
|
.00038115
|
1,782,372,520
|
679,359
|
|
Total
Special Rates
|
|
|
|
|
6,363,148
|
|
Total
Ordinary and Special Rates
|
96,041,283
|
|
less
Pensioner Rebates
|
-2,627,894
|
|
less
Internal Rates Contra
|
-489,640
|
|
Net
Total Ordinary and Special Rates
|
92,923,749
|
* As per advice from the Division
of Local Government, it was recommended that Council amend its Rating Structure
due to the fact that the Residential CBD Rate had 97.6% of Ratepayers on the
minimum Rate. “The overriding characteristic of local government rating is that
the assessments are primarily and predominantly determined via the ad valorem
method whereby the incidence of any rate burden is split differentially based
on the value of rateable property.” As a consequence of this advice, Council
has merged it Residential & Residential CBD Rate. This has also resulted in
the CBD Residential Infrastructure Special Rate being obsolete and merged with
the Suburban Infrastructure Special Rate. It has been renamed as
“Infrastructure Special Rate”.
Special Rates 2012/13
The table below details the
percentage of the total yield that the base amount will produce for each of the
following special rates:
|
Special
Rate
|
Base
Amount Yield %
|
|
Open
Space Acquisition and Embellishment
|
50%
|
|
Infrastructure
|
25%
|
Impact on average ratepayers
The following tables show the
average impact on ratepayers and include Special Rates, Waste Management
Charges and the Stormwater Management Charge.
|
|
2011/12
|
2012/13 Rates
|
|
($)
|
($)
|
|
|
Combined
Rates
|
Combined
Rates
|
Increase
Per Qtr
|
|
Average
Residential Property
|
1,132.89
|
1,201.52
|
17.16
|
|
Average
Business General Property
|
4,919.13
|
5,019.56
|
25.11
|
|
Average
Business CBD Property
|
12,786.59
|
13,235.18
|
112.15
|
|
Average
Business CBD # 2
|
292,860.62
|
305,391.03
|
3,132.60
|
|
Average
Business ICA
|
12,346.67
|
13,043.34
|
174.17
|
|
Average
Business ICA #2
|
691,034.58
|
719,597.33
|
7,140.69
|
SPECIAL RATES INCOME AND
EXPENDITURE
The following tables show the
estimated income and expenditure for each of the special rates.
|
Name: Suburban
Infrastructure Enhancement - Infrastructure
|
Start Date:
2000/01
|
Finish Date: On going
|
|
Purpose: To fund urban
infrastructure (roads, kerb and gutter, improvement to town centres and
waterways)
|
|
Rating Base: All rateable
properties outside the Central Business District
|
|
Income and Expenditure
($000)
|
|
Estimated Balance
(01/07/2012)
|
Estimated
Income (inc. Interest)
|
Estimated Expenditure
|
Estimated Balance (30/06/2013)
|
|
102
|
592
|
658
|
36
|
|
Projects to be funded from
Special Rates
|
|
Type of Works
|
Description
|
Budget ($,000)
|
|
Fair Value of Assets
|
Legislative requirement for
Asset Revaluation of Buildings, Land, Plant & Equipment, Office Furniture
& Other Structures.
|
140
|
|
Civil Construction Program
|
Footpath and Kerb & Gutter
construction at various streets in the LGA
|
370
|
|
Flood Mitigation
|
Rehabilitation of various
creeks in the LGA to safely accommodate flood waters and convey it to
downstream rivers without causing damages.
|
148
|
|
Total
|
658
|
|
|
|
|
|
|
Name: Suburban
Infrastructure Enhancement - Environment
|
Start Date: 2000/01
|
Finish Date: On going
|
|
Purpose: To fund urban
infrastructure (roads, kerb and gutter, improvement to town centres and
waterways)
|
|
Rating Base: All rateable
properties outside the Central Business District
|
|
Income and Expenditure
($,000)
|
|
Estimated Balance
(01/07/2012)
|
Estimated Income
(inc. Interest)
|
Estimated Expenditure
|
Estimated Balance
(30/06/2013)
|
|
563
|
823
|
888
|
498
|
|
Projects to be funded from
Special Rates
|
|
Type of Works
|
Description
|
Budget ($,000)
|
|
Waterways Restoration
|
Creek and foreshore
stabilisation works at eight locations identified in the Council adopted
Environmental Improvement Program
|
320
|
|
Fishladder Construction
|
Construction of the final
(fourth) fishway opposite the Cumberland Hospital weir to allow fish access
to the upper Parramatta River Catchment
|
300
|
|
Waterways Litter Reduction
|
Litter removal from waterways
and adjoining creek banks following rain events
|
53
|
|
Wildlife Surveys
|
Wildlife surveys of core
Bushland areas to establish baseline data on fauna diversity
|
50
|
|
Sustainable Water Program
|
Stormwater reuse project Doyle
Ground Parramatta and soil improvement study at 2 sportsgrounds to minimise
irrigation requirements
|
50
|
|
Waterways Rehabilitation Masterplan
|
Preparation of the Duck River catchment Rehabilitation Masterplan and wetlands plan of management (with Auburn
Council)
|
50
|
|
Parramatta River Estuary Management Plan
|
Finalisation of the Parramatta
River Estuary Study and Plan on behalf of 7 foreshore councils
|
50
|
|
Catchment Modelling – flood studies
|
Contribution towards flood
study modelling in accordance with adopted plan
|
15
|
|
Total
|
888
|
|
|
|
|
|
|
|
Name: Suburban
Infrastructure Enhancement - Neighbourhood
|
Start Date: 2000/01
|
Finish Date: On going
|
|
Purpose: To fund urban
infrastructure (roads, kerb and gutter, improvement to town centres and
waterways)
|
|
Rating Base: All rateable
properties outside the Central Business District
|
|
Income and Expenditure
($000)
|
|
Estimated Balance
(01/07/2012)
|
Estimated Income (inc.
Interest)
|
Estimated Expenditure
|
Estimated Balance
(30/06/2013)
|
|
358
|
332
|
195
|
495
|
|
Projects to be funded from
Special Rates
|
|
Type of Works
|
Description
|
Budget ($000)
|
|
CAP Neighbourhood Improvement Program
|
Ongoing upgrades to Streetscape and infrastructure across the city.
This includes upgrades to footpaths, laneways and the foreshore.
|
195
|
|
Total
|
195
|
|
|
|
|
|
|
Name: Economic Development
|
Start Date: 2000/01
|
Finish Date: N/A
|
|
Purpose: To support the
achievement of Regional Economic Plan targets for employment in the Parramatta Primary Centre
|
|
Rating Base: All rateable
properties in the Parramatta Primary Centre
|
|
Income and Expenditure
($000)
|
|
Estimated Balance
(01/07/2012)
|
Estimated Income (inc.
Interest)
|
Estimated Expenditure
|
Estimated Balance
(30/06/2013)
|
|
259
|
692
|
699
|
252
|
|
Projects to be funded from
Special Rates
|
|
Type of Works
|
Description
|
Budget ($000)
|
|
Economic Development
|
The economic development project’s goals are to help Parramatta transition into a fully-functioning second city for Sydney, and to help grow
employment in the primary area. The 2012 allocation covers strategy and brand
development, high-level advocacy, business growth/attraction, support for
liveability
|
639
|
|
Rydalmere Technology Precinct
|
The Rydalmere project includes Studies to enable the
possible transition of the Brodie Street precinct into a Technology Precinct
|
60
|
|
Total
|
699
|

|
Name: Open Space Acquisition
& Embellishment
|
Start Date:
N/A
|
Finish Date: N/A
|
|
Purpose: To fund acquisition
of open space and embellishment of Parks and Public Domain
|
|
Rating Base: All rateable
properties in the Parramatta Local Government Area
|
|
Income and Expenditure
($000)
|
|
Estimated Balance
(01/07/2012)
|
Estimated Income (inc.
Interest)
|
Estimated Expenditure
|
Estimated Balance
(30/06/2013)
|
|
786
|
2,248
|
2,561
|
473
|
|
Projects to be funded from
Special Rates
|
|
Type of Works
|
Description
|
Budget ($000)
|
|
Restoration
of Natural Areas
|
Bushland restoration &
regeneration works to 5 core areas of the bushland reserves to reduce the
extent of noxious weeds & enable improved public access to the bushland
sites
|
550
|
|
Pavilion Program
|
Replacement &/or upgrading
of sporting pavilions & amenities buildings within parks
|
500
|
|
Walking Track Construction
|
Provision of bush walking tracks
within the public open space & natural areas
|
110
|
|
Parks Program
|
Minor park improvements
including fencing; paths; seating; picnic shelters; landscaping plus matching
funding for grant funded projects by NSW Sport & Recreation
|
70
|
|
Sportsground Program
|
Improvements to sporting fields
including rebuilding, drainage, irrigation, fencing & floodlighting
|
400
|
|
Cultural Parks Program
|
Restoration of headstones &
monuments at the 3 heritage cemeteries & historic memorials &
monuments within parks.
|
85
|
|
Bushland Resources Mgt
|
Bushland restoration &
regeneration works to 5 core areas of the bushland reserves to reduce the
extent of noxious weeds & enable improved public access to the bushland
sites
|
433
|
|
Asbestos Removal
|
Removal & or related
control measures to manage asbestos materials regularly illegally dumped
within bushland reserves
|
53
|
|
Playground Replacement
|
Replacement of 4-5 children’s’
playgrounds per annum within parks & reserves. This ensures the equipment
installed is modern, well used & complies with relevant safety standards
|
30
|
|
Protection of Aboriginal
Heritage
|
Management & protection of
known aboriginal heritage sites within the parks, waterways & other
public natural areas. This includes identification, interpretative signage,
monitoring, protective fencing & investigations.
|
25
|
|
Environmental Education
|
Resource funding for various
annual environmental education displays, programs & projects including
Australia Day, World Environment Day, National Tree Day, assistance to
schools. Funding for Spring Garden Competition promotion & advertising.
|
20
|
|
City of Trees
|
Annual
tree planting program to provide additional street & parks trees to green
the city & enhance neighbourhood streetscapes. Provision of shade trees
around park playgrounds & sporting fields.
|
85
|
|
Contaminated Lands -
Investigation
|
Investigate identified parks
& reserves with contamination history to determine the type and extent
of contamination
|
200
|
|
Total
|
2,561
|
|
Name: CBD Infrastructure
Enhancement
|
Start Date: 2000/01
|
Finish Date: N/A
|
|
Purpose: To support the
improvement of the Infrastructure in the CBD
|
|
Rating Base: Land categorised
as Business CBD and Business Centre of Activity # 2
|
|
Income and Expenditure
($000)
|
|
Estimated Balance
(01/07/2012)
|
Estimated Income (inc.
Interest)
|
Estimated Expenditure
|
Estimated Balance
(30/06/2013)
|
|
4,510
|
2,223
|
2,021
|
4,712
|
|
Projects to be funded from
Special Rates
|
|
Type of Works
|
Description
|
Budget ($000)
|
|
City Centre Streetscape
|
Ongoing upgrades to Streetscape
and infrastructure across the city. This includes upgrades to footpaths,
laneways and the foreshore.
|
1,721
|
|
Foreshore Improvement
|
This project is part of the
revitalisation of the Parramatta River Foreshore and involves the
construction of a children’s playground on the northern riverbank.
|
120
|
|
Darcy Street Property Upgrades
|
Upgrade of Darcy Street
Properties
|
150
|
|
Place Activation
|
Pilot study on innovative
activation programs in urban centres to economically and socially enliven
centres. These programs will assistance local business and deliver innovative
events for local neighbourhood centres throughout the LGA.
|
30
|
|
Total
|
|
2,021
|
|
|
|
|
|

|
Name: Parking Meters
Revenue, Expense and Usage
|
|
Income and Expenditure
($000)
|
|
Estimated Balance
(01/07/2012)
|
Estimated Income
|
Estimated Expenditure
|
Estimated Balance
(30/06/2013)
|
|
3,497
|
Gross
Income 4,696
|
5,838
|
1,142
|
|
Operational
Expenditure* 1,213
|
|
Net
3,483
|
|
*Excludes
depreciation
|
|
Services and Projects to be
funded from Parking Meter Revenue
|
|
Type of Works
|
Description
|
Budget ($000)
|
|
Crime Prevention - Rapid
Deployment of CCTV Cameras
|
Purchase and deployment of
wireless mobile digital CCTV cameras for crime prevention, enforcement,
detection and public safety.
|
100
|
|
Paid Parking Plan
|
Purchasing and installation of
new parking meters and associated management system
|
3,200
|
|
Footpath and Access
|
Pedestrian Access and Mobility
Program
|
1,200
|
|
Major Events
|
Major Events Program
|
470
|
|
Major Events
|
Parramasala - Contribution for
Australian Festival of South Asian Culture to supplement funding from Events
NSW
|
300
|
|
Arts Services
|
Artist Studios Projects
|
227
|
|
Urban Designers
|
Improving Urban Design
|
341
|
|
Total
|
5,838
|
Annual
Charges—Stormwater Management Charge
In accordance with the Local
Government Amendment (Stormwater) Act 2005, Parramatta City Council introduced
a Stormwater Management Charge in the 2006/07 year. The Stormwater Management
Charge is levied on all parcels of rateable urban land within the City of
Parramatta categorised for rating purposes as Residential or Business
(including all sub categories), not being vacant land or land owned by the
Crown, or land held under lease for private purposes under the Housing Act 2001
or the Aboriginal Housing Act 1998.
Council administers a
comprehensive waterways management program that is underpinned by its long-term
strategic plan, Rivers of Opportunity, available for download from -
www.parracity.nsw.gov.au/home/publications/list_of_publications
A database of prioritised waterways
activities required to fulfil the plan is being implemented as available funds
allow. As the principal authority responsible for the management of
stormwater, Council:
· maintains 438 km of stormwater discharge
drainage pipes for stormwater conveyance.
· implements essential flood mitigation
measures to protect life, property and infrastructure.
· conserves the natural waterways of the
City.
· protects bushland and other natural
assets from the impacts of urban runoff by implementing purpose-built pollution
control traps and water retention systems.
The maintenance and operational
costs associated with stormwater infrastructure throughout the City of Parramatta are estimated at $1.4 million per annum. This cost includes maintenance of drainage
systems, ongoing management of impacts from stormwater runoff on natural areas
and the cleaning of pollution control devices within the public domain.
|
Name: Stormwater Revenue,
Expense and Usage
|
|
Services and Projects to be
funded from Stormwater Revenue
|
|
Estimated Balance
(01/07/2012)
|
Estimated Income
|
Estimated Expenditure
|
Estimated Balance
(30/06/2013)
|
|
391
|
1,382
|
1,370
|
403
|
|
Service/Project
|
Description
|
Source of Funds
|
Budget, ($000)
|
|
Riparian Maintenance
|
Protection of the City's
natural waterways from the impacts of urban runoff such as weeds and litter
|
SL
|
450
|
|
Stream Health and Waterways Monitoring
|
Monitoring of the waterways to
determine the effectiveness of the implemented measures
|
SL
|
120
|
|
Pollutant Trap Cleaning
|
Ongoing maintenance of
pollution control devices to protect the City's waterways
|
SL
|
150
|
|
Stormwater Reuse Parks
|
Provision of stormwater
harvesting and reuse facilities in parks and reserves
|
SL
|
130
|
|
Drainage Maintenance
|
Upgrading the existing
stormwater system to maximise efficient conveyance of runoff for the
protection of life and property
|
SL
|
520
|
|
|
|
TOTAL
|
1,370
|
|
|
SR Special Rate GR
General Revenue G Grants L Loans D Developer
Contrib. SL Stormwater Levy
|
|
|

|
Stormwater
Services & Projects funded from sources other than the Annual Charge
|
|
Service / Project
|
Description (In $’000)
|
Source of Funds
|
Budget
|
|
Sustainable
Water Program
|
Water
conservation and reuse measures in accordance with adopted 4 year Waterways
Environmental Improvement program
|
SR
|
50
|
|
Water
Quality Improvement
|
Capital
works projects to improve water quality eg. Pollutant treatment assets
|
L
|
300
|
|
Water
ways Rehabilitation Master planning
|
Sub-catchment
master planning to address degraded riparian and estuarine corridors
|
SR
|
50
|
|
Floodplain
Risk Mgmt Planning
|
Whole
of catchment planning to address floodplain risk and prioritised flood
mitigation measures
|
GR,G
|
120
|
|
Flood
Mitigation Program
|
Capital
works projects to address flood mitigation and to minimise flood damage /
risk
|
GR,
SR
|
360
|
|
Catchment
Modelling Program
|
Catchment
based modelling for flood mitigation, drainage alleviation and water quality
improvement
|
GR,
SR
|
100
|
|
Drainage
Construction Program
|
Capital
works projects to improve local drainage systems and hence stormwater
flooding problems
|
GR
|
520
|
|
Waterways
Restoration
|
Restoration
of natural waterways in terms of bank stabilisation, weed control, native
planting and channel improvement works
|
SR
|
320
|
|
Waterways
Litter Reduction
|
Removal
of litter from priority waterways after rain events
|
SR
|
53
|
|
Drainage
Improvements to Future RDS Areas
|
Areas
flagged for increased residential development will have existing drainage
assets upgraded and amplified to meet increased stormwater run off demands
|
D
|
60
|
|
|
SR- Special Rate; GR -
General Revenue; G - Grants; L - Loans; D - Developer
Contribution; SL - Stormwater Levy
|
TOTAL
|
1,933
|
 Annual Charges—Stormwater Management Charge
|
Residential Properties
|
Annual
Charge Per Assessment
|
|
All
parcels of rateable urban land categorised as Residential or Residential CBD
excluding Strata properties
|
$25.00
|
|
All
strata properties categorised as Residential or Residential CBD
|
$12.50
|
|
Estimated
Yield
|
$1,071,213
|
|
|
|
|
|
|
|
Business
Properties
|
Annual
Charge Per Assessment
|
|
Per
350sq metres or part thereof capped at $200
|
|
All
parcels of rateable urban land categorised as Business (all sub categories)
including Business Strata properties
|
$25.00
|
|
Estimated
Yield
|
$
194,349
|
|
|
|
|
Total
Estimated Yield
|
$1,265,562
|
Domestic Waste Management
Charges
Domestic
Waste Management services are provided on a full cost recovery basis. Costs are
determined by contractor charges for collection, management and treatment of
waste, and the costs for education and environmental awareness programs and
associated Council overheads necessary to manage the service. In 2012/13 the
charges will increase by 10%. The increased charge reflects an ongoing
improvement in Council’s approach to waste management and resource recovery.
Domestic
Waste Management Availability Charge
Section 496 of the Local
Government Act, 1993 specifies that councils must make and levy an annual
charge for the provision of Domestic Waste Management services for each parcel
of rateable land for which the service is available. The charge levied is
proportionate to the administrative costs of providing the service.
Commercial
Waste Management Charges
Section 501
of the Local Government Act 1993 provides that a council may make an annual
charge for Commercial Waste Management Services. The annual charge may be
levied on each parcel of rateable land for which the service is provided or
proposed to be provided. The council may make the charge for the service
according to the actual use of the service. Commercial Waste Management
services are provided on a full cost recovery basis. Costs are determined by
contractor charges, disposal costs and associated Council overheads necessary
to manage the service. Commercial charges apply to individual enterprises which
have opted to use Council’s service.
Annual
Charges—Waste Management Services
Annual Charge for
the provision of Waste Management Services under Section 501 and Section 496 of
Local Government Act 1993 to be levied are as follows:
|
Service
Level
|
Service
Mix
|
Pickup
Frequency
|
Fees
|
Annual
Charge per Property
|
Yield
|
|
Domestic
|
|
|
|
|
|
|
|
Basic
Service
|
Domestic
Waste
Collection
|
1per
week
|
140
Ltr $319.99
|
240
Ltr $482.31
|
|
$18,427,047.11
|
|
|
Collection
of
Recyclables
|
1per
fortnight
|
Included
|
Included
|
|
|
|
Collection
of
garden waste
|
1per
fortnight
|
Included
|
Included
|
|
|
Additional
Services
|
Per
bin
|
1per
week
|
140
Ltr $319.99
|
240
Ltr $482.31
|
|
|
|
Recycling
|
1per
fortnight
|
|
|
240
Ltr
$92.95
|
$22,493
|
|
|
Garden
Waste
|
1per
fortnight
|
|
|
240
Ltr
$92.95
|
$14,872
|
|
Unoccupied
Land
|
Availability
|
Not
applicable
|
|
|
$55.20
|
$41,565
|
|
|
|
|
|
|
TOTAL
|
$18,505,977
|
|
Commercial
|
|
|
|
|
|
|
|
Basic
Service
|
Commercial
Waste
Collection
|
1
per week
|
140
Ltr $327.77
|
240
Ltr $493.91
|
|
$1,273,957
|
|
Additional
Services
|
Per
Bin Collection Waste
|
1
per week
|
140
Ltr $327.77
|
240
Ltr $493.91
|
|
|
|
|
Recycling
(new)
|
1per
fortnight
|
|
|
240
Ltr
$97.24
|
$21,198
|
|
|
Garden
waste (new)
|
1per
fortnight
|
|
|
240
Ltr
$97.24
|
$6320
|
|
This
statement does not include the impact of rebates given by Council and
therefore differs from the financial statements
|
|
|
|
|
TOTAL
|
$1,301,475
|
|
Excludes
GST
|
|
|
TOTAL
DOMESTIC & COMMERCIAL WASTE
|
$19,807,452
|
Section 611 Charges
Section 611 of the Local
Government Act 1993 provides that Council may make charges on persons for the
time being in possession, occupation or enjoyment of a rail, pipe, wire, pole,
cable, tunnel or structure laid, erected, suspended, constructed or placed on,
under or over a public place.
Where applicable, such charges
will be made in 2012/13 and will be based on the nature and extent of the
benefit enjoyed by the person concerned.
|
Item
11.3 - Attachment 2
|
Draft 2012/13 Fees and Charges (Distributed under
separate cover to Councillors and Senior Staff. For a copy pls contact
council support on 98065314)
|
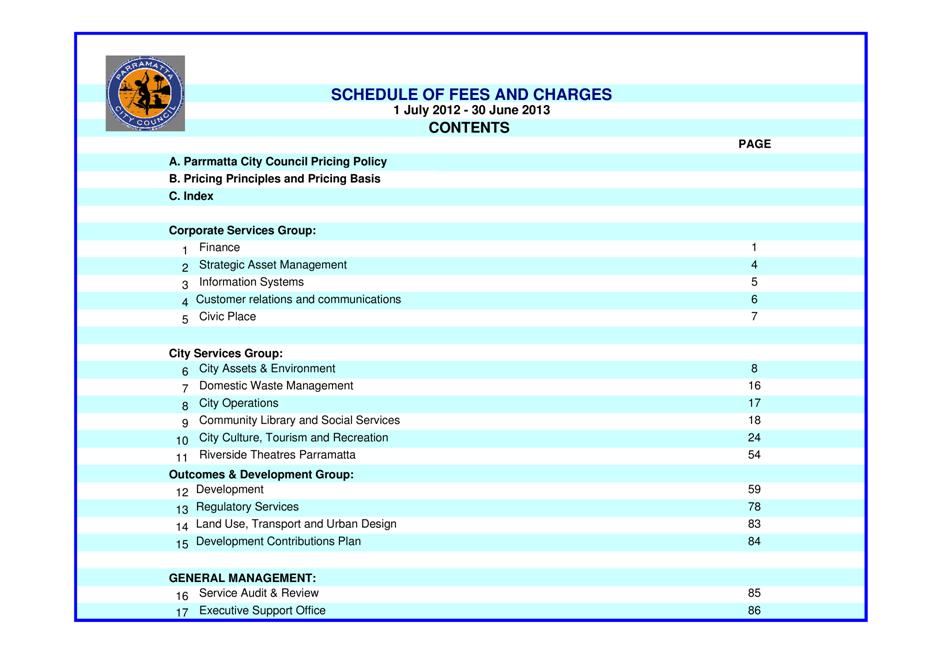
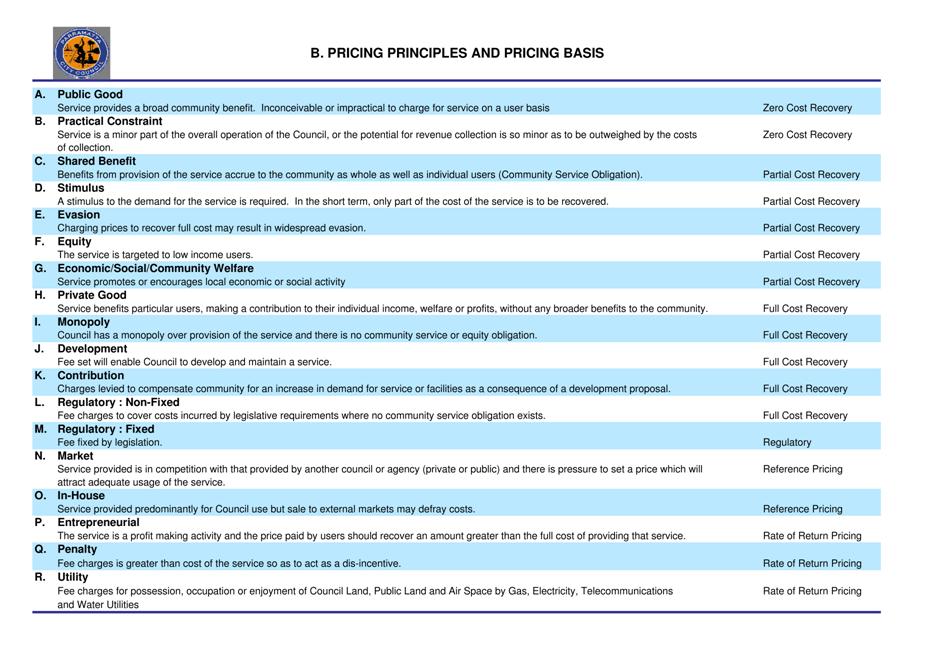
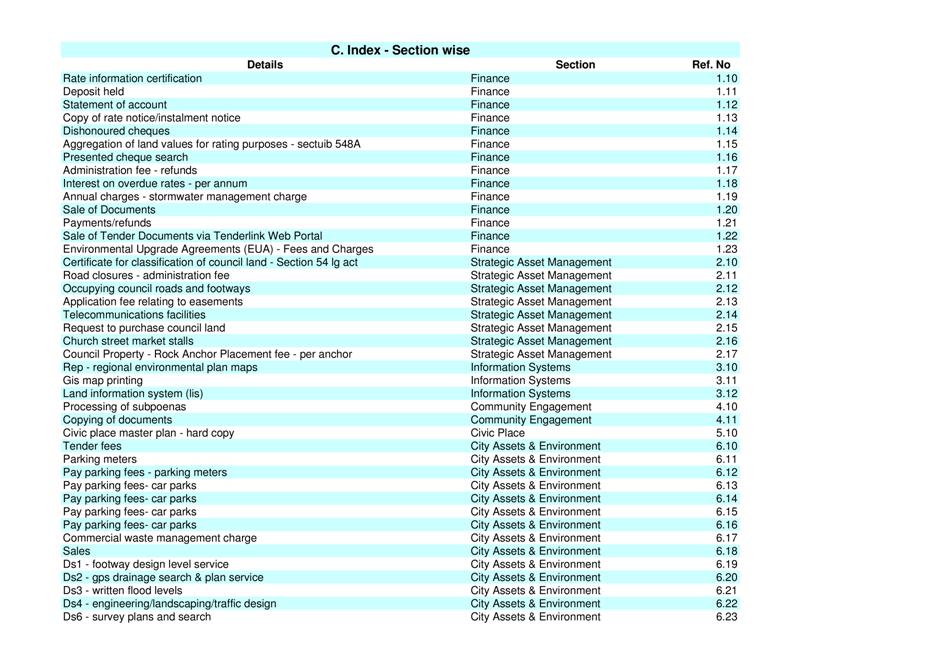
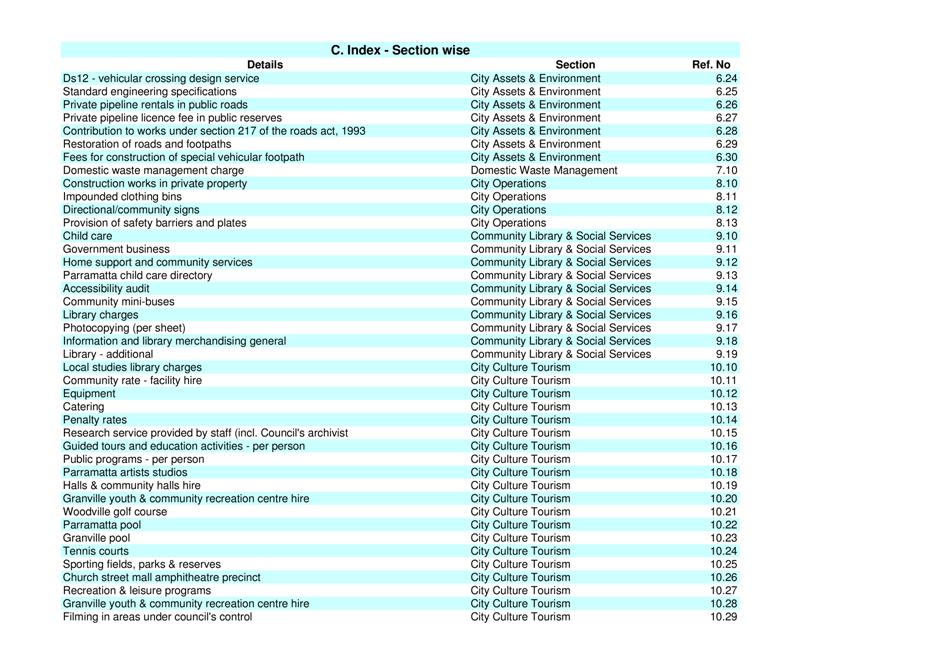
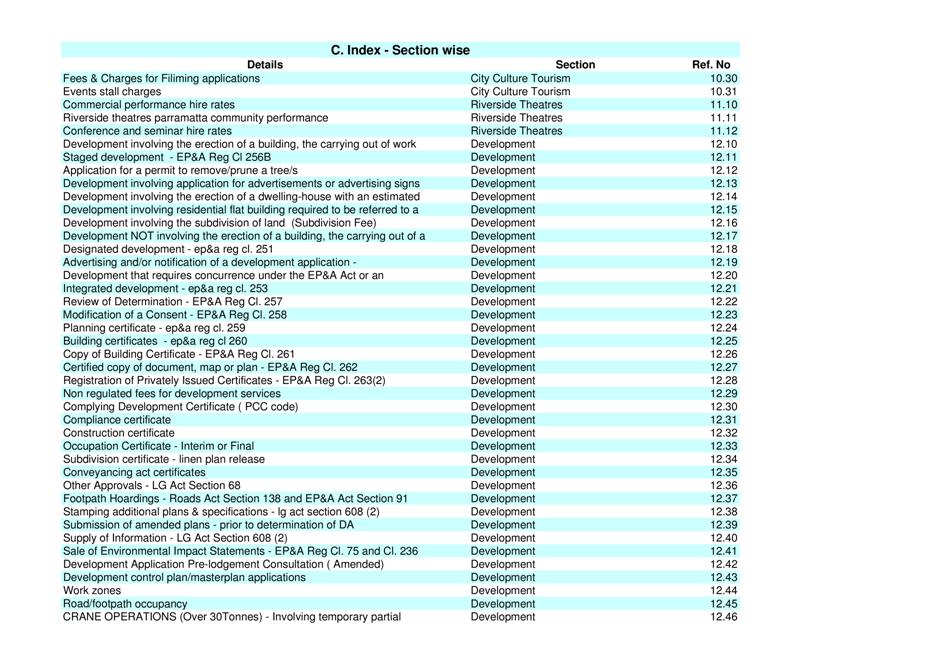
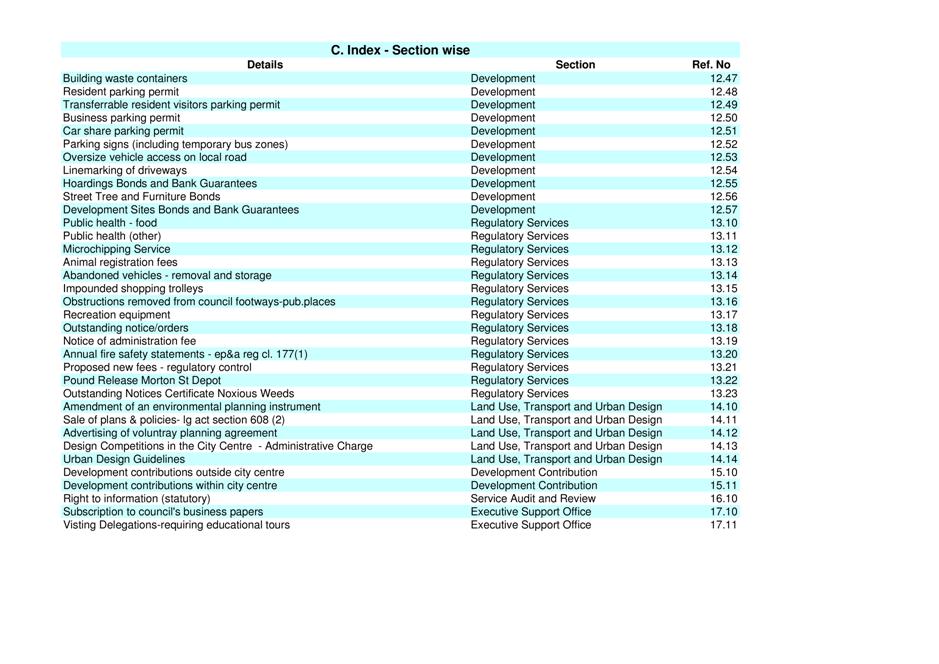
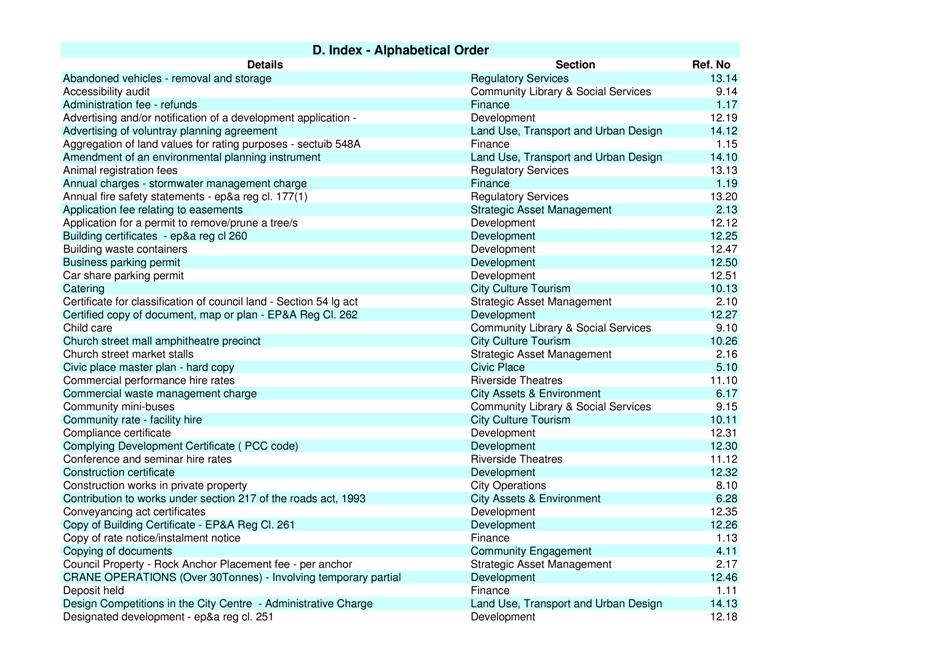
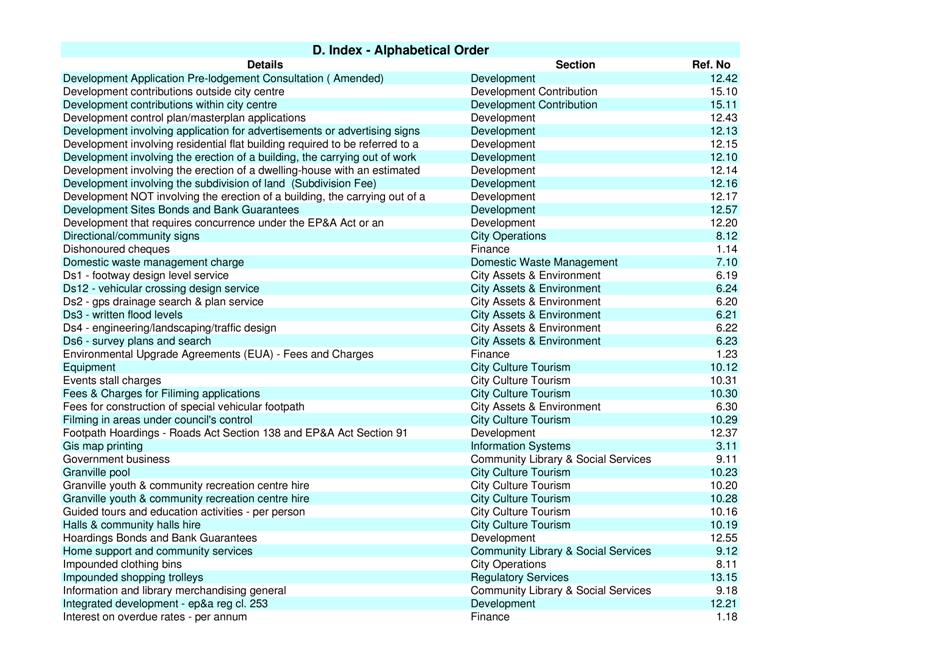
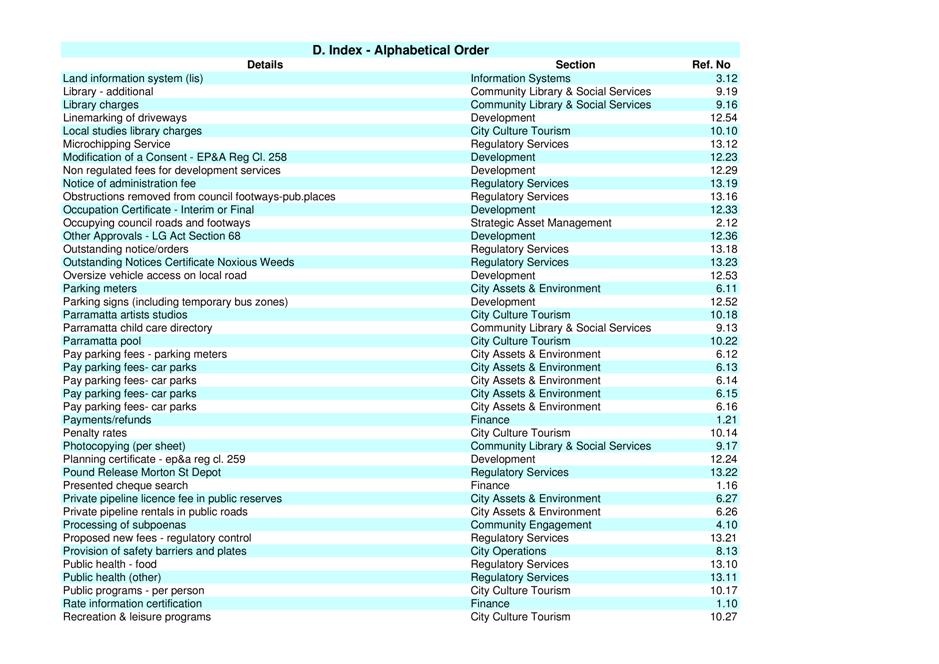
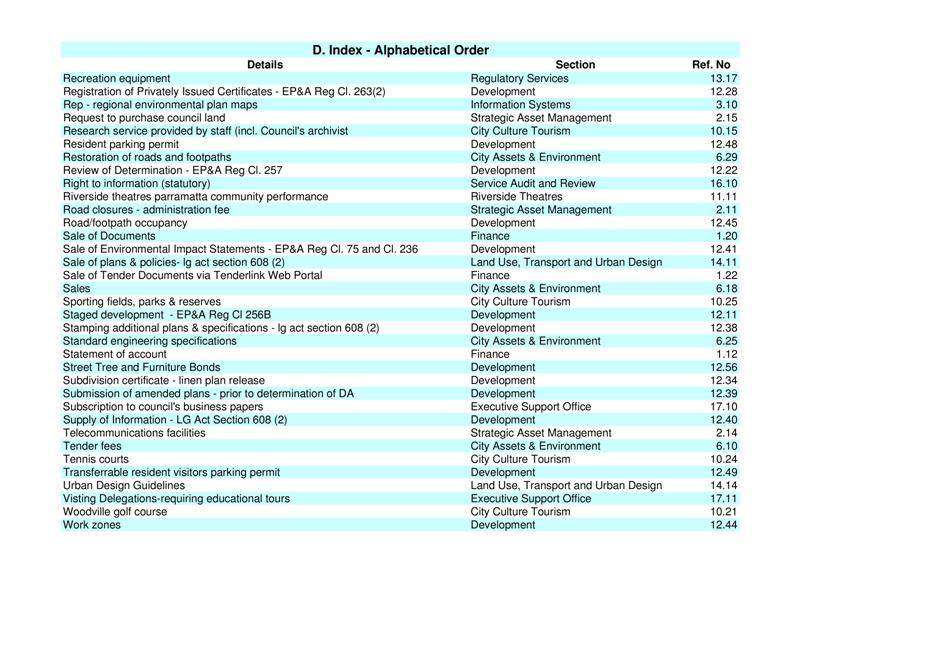
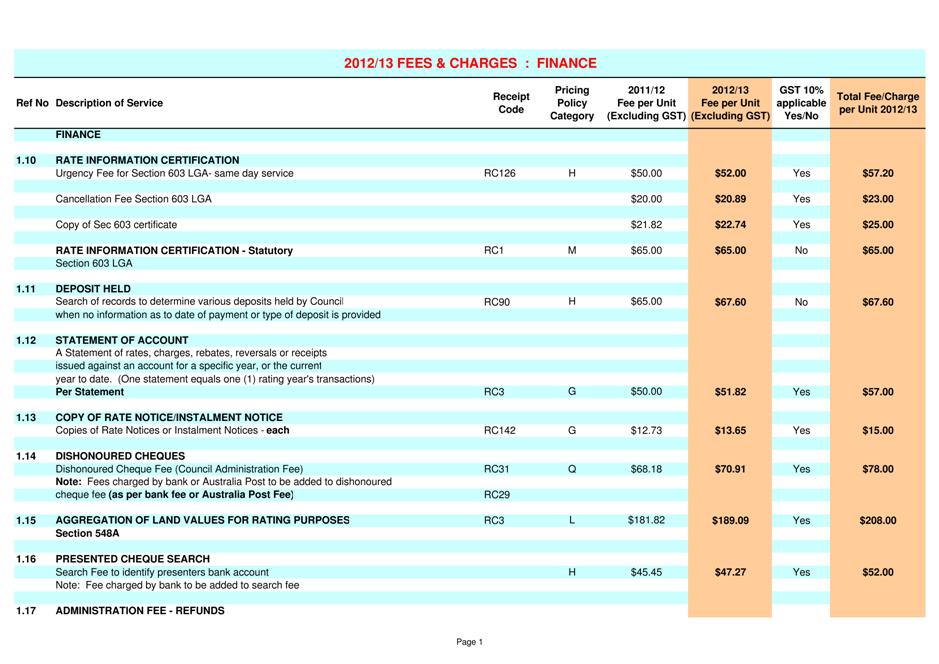
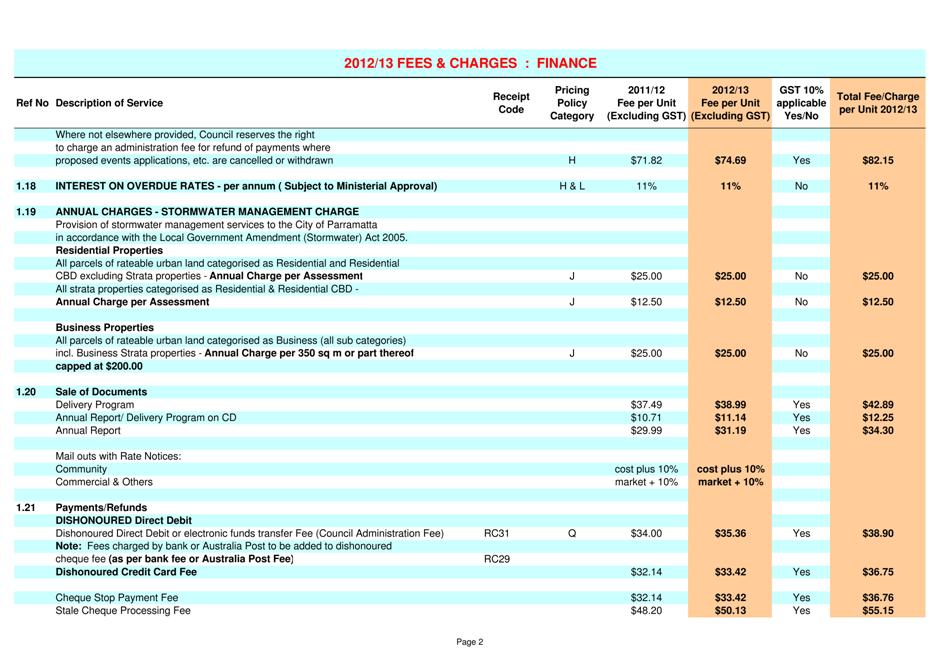
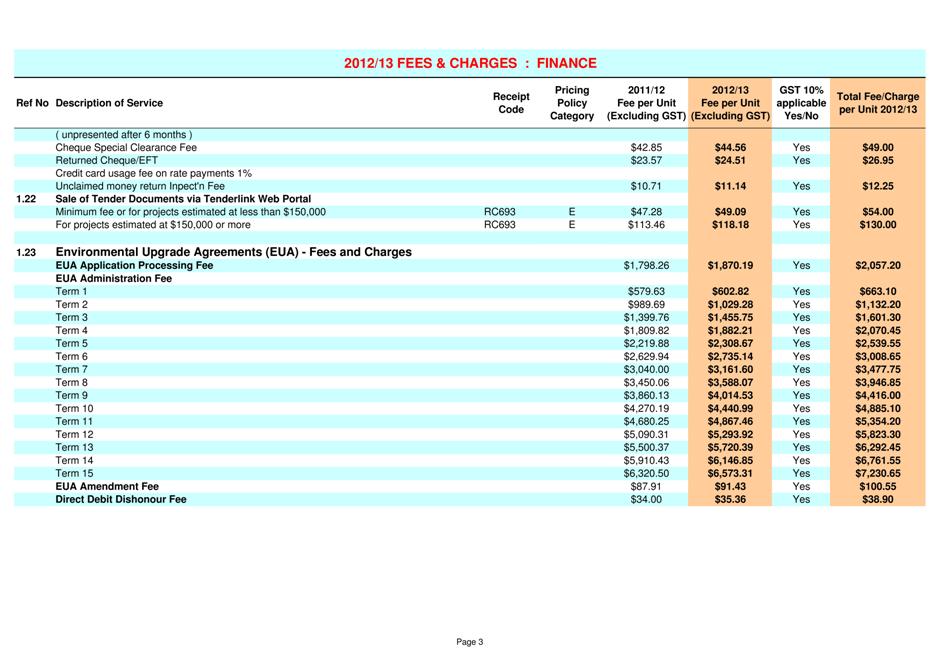
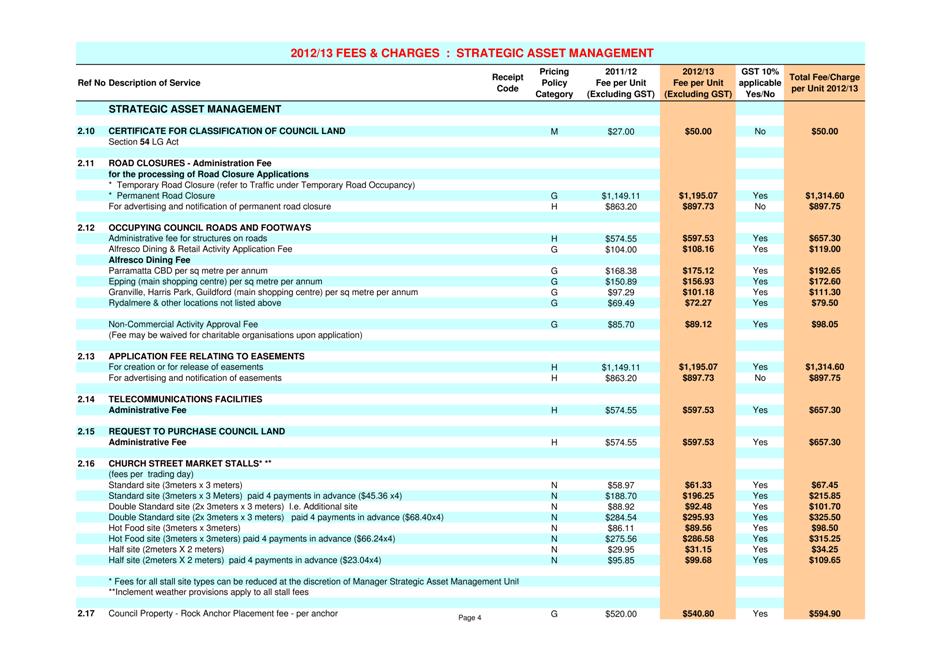
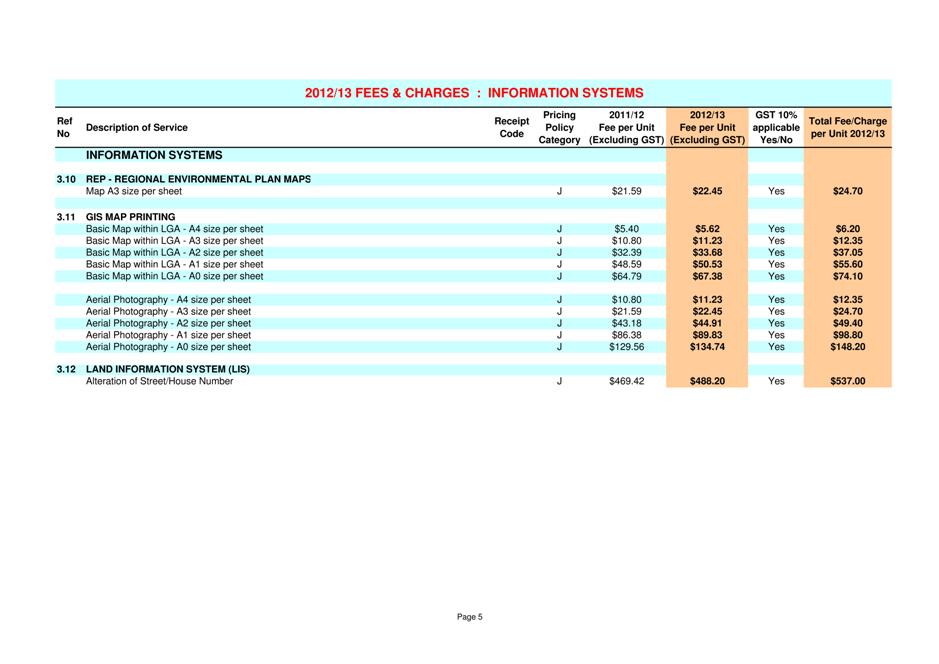
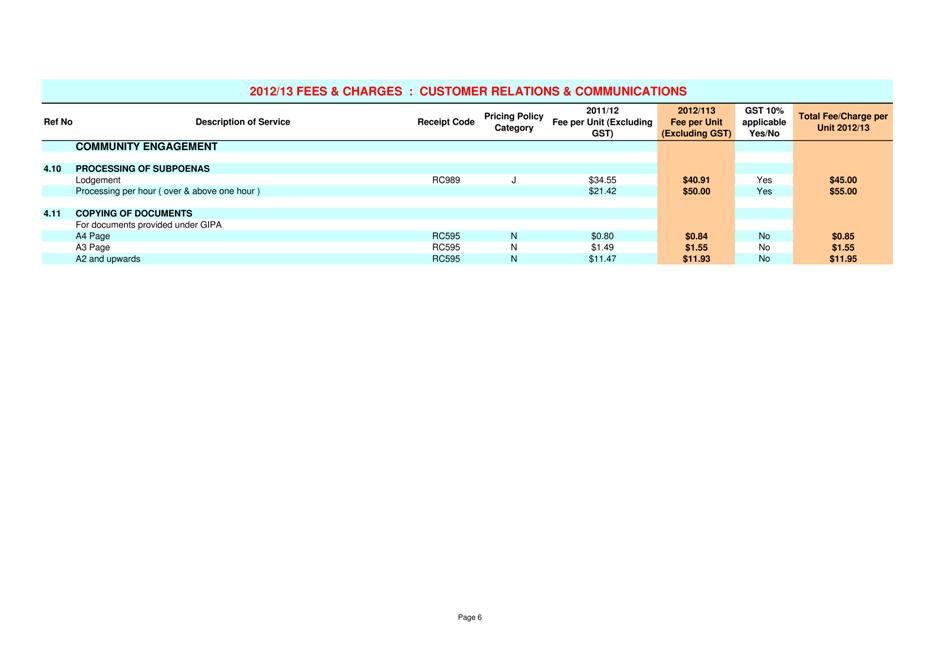
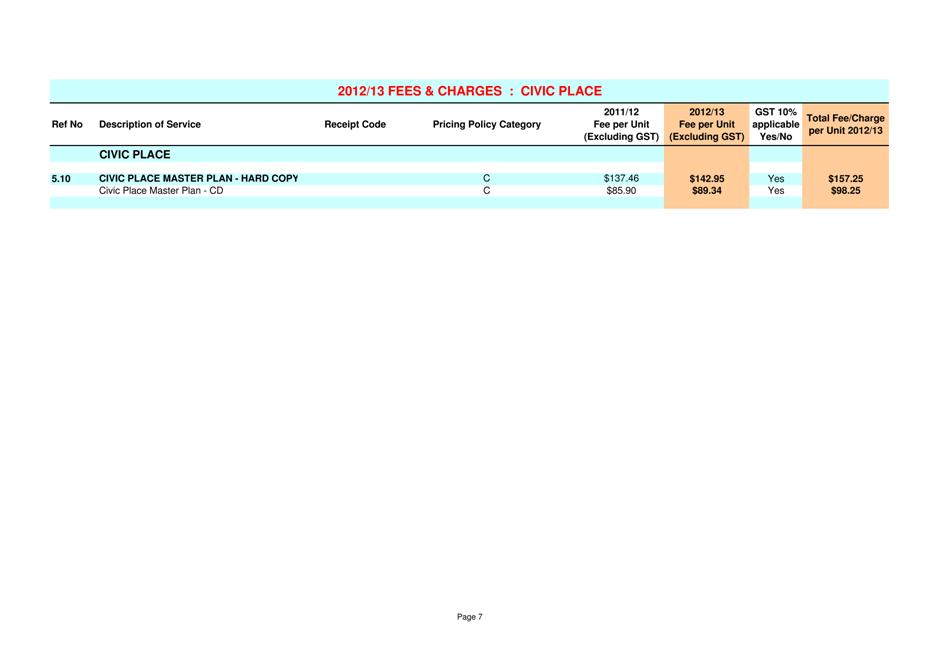
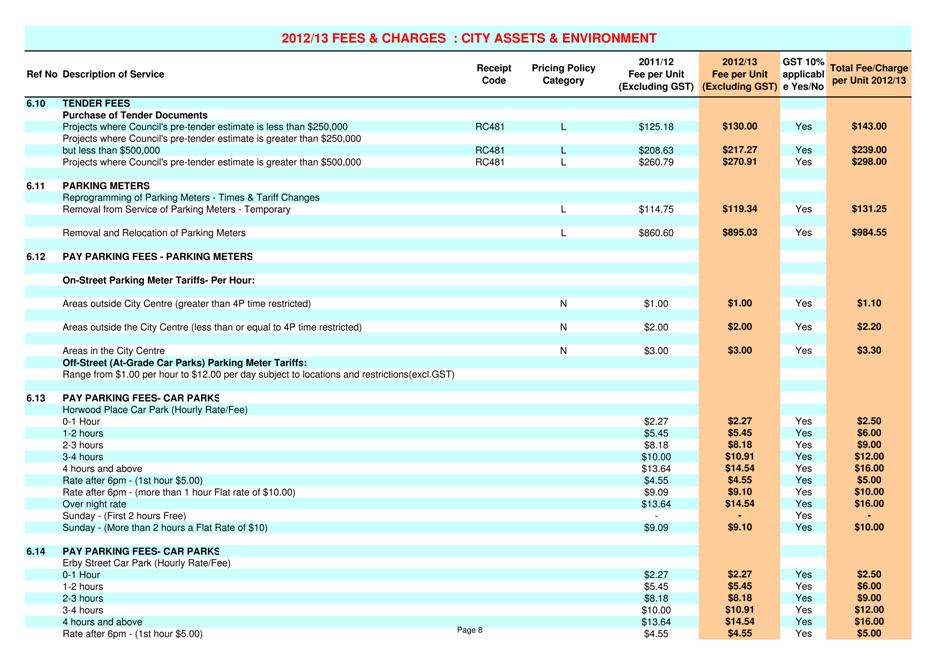
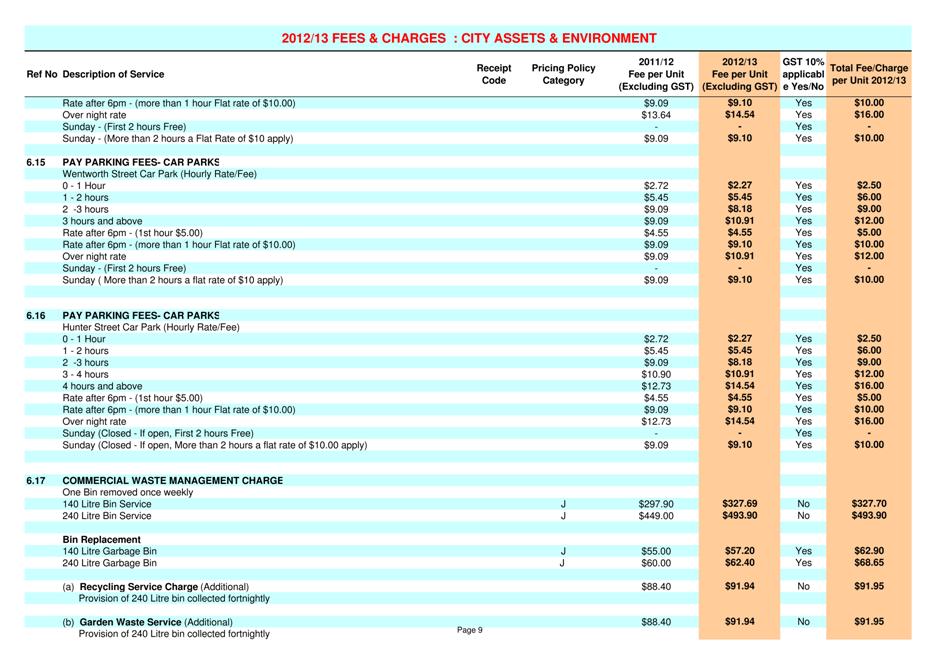
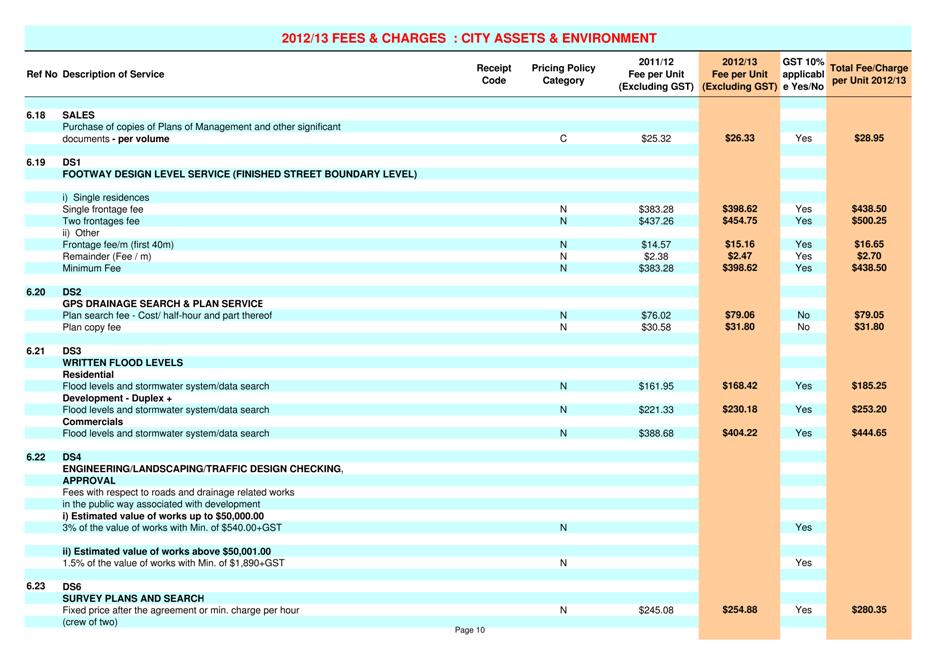
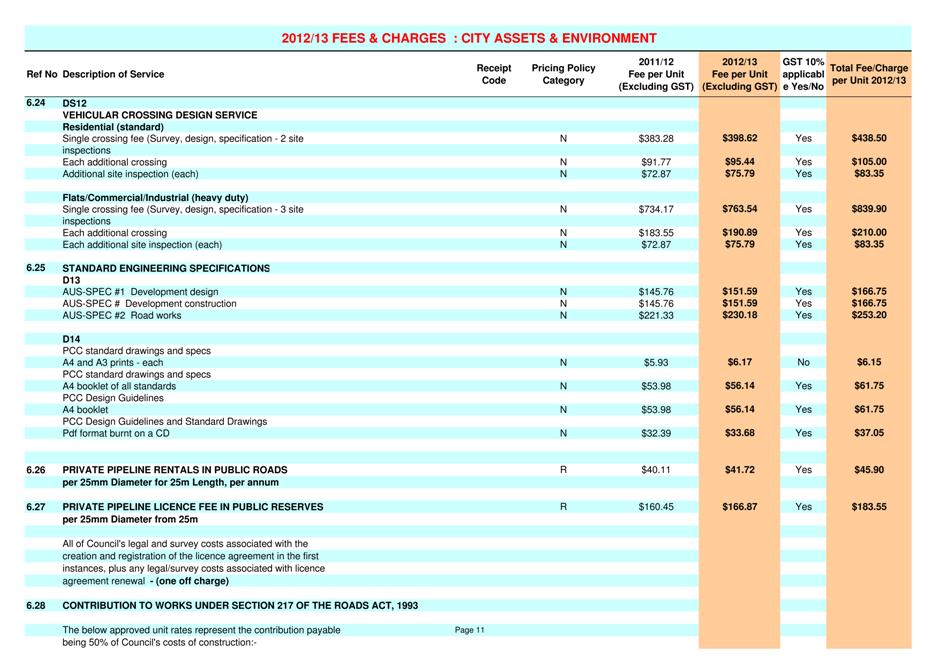
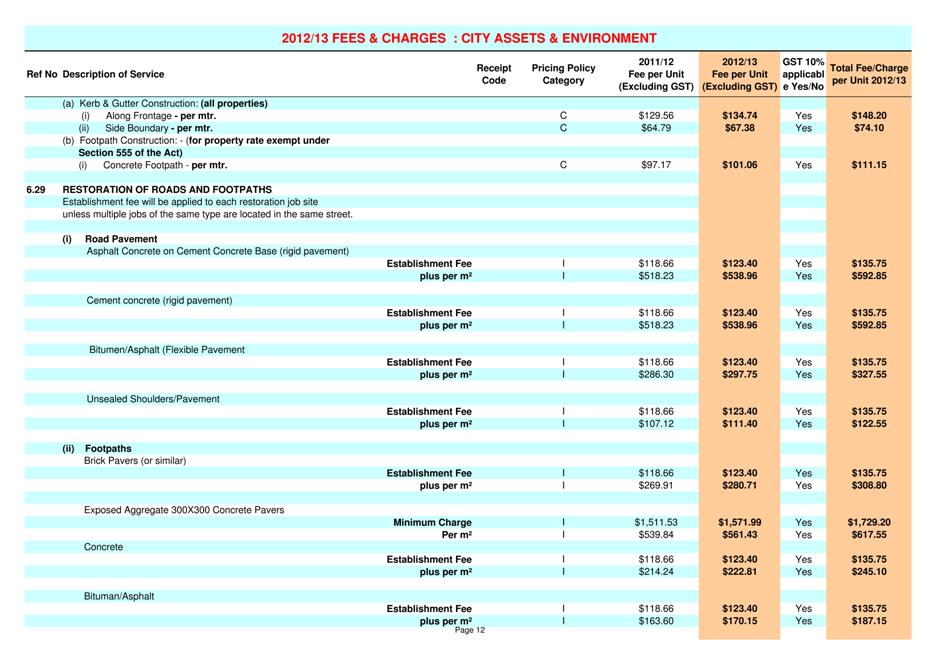
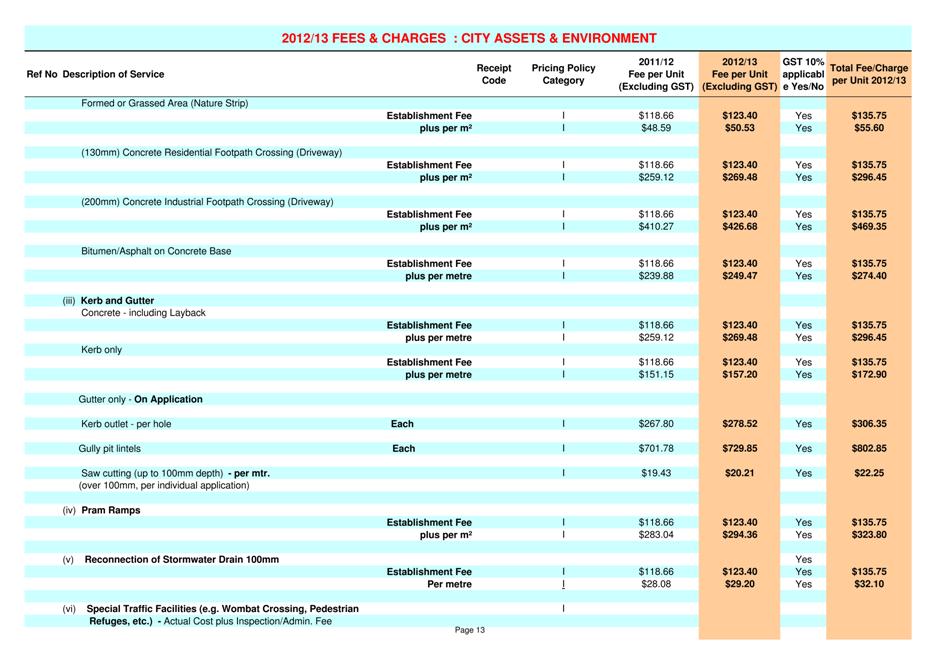
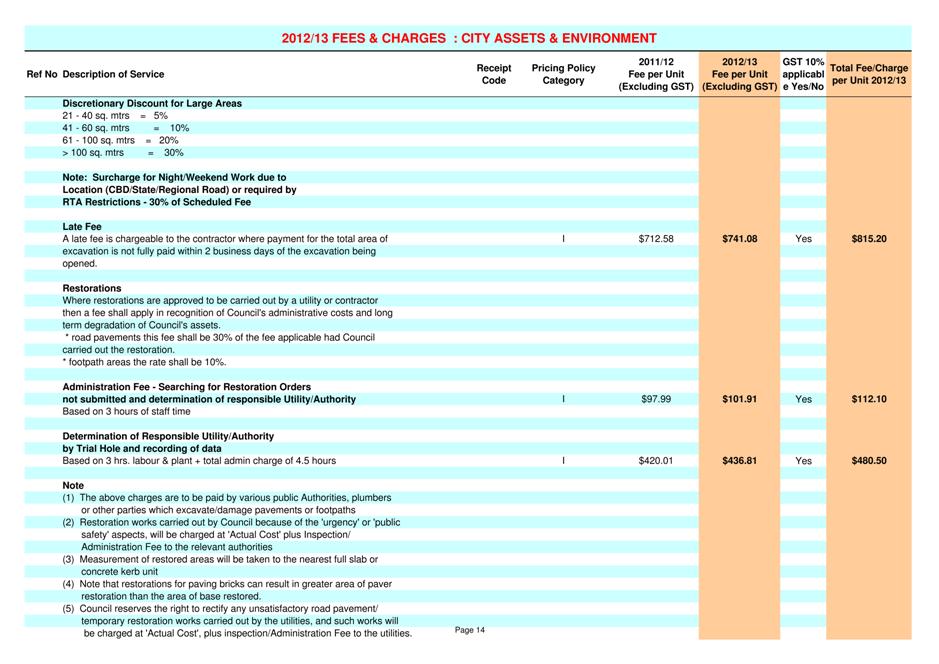
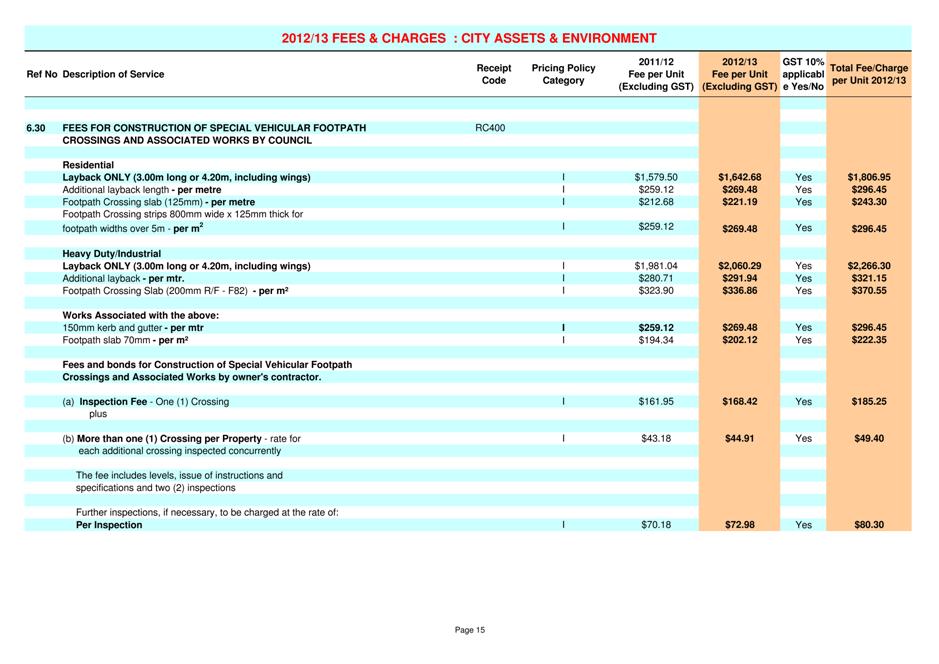
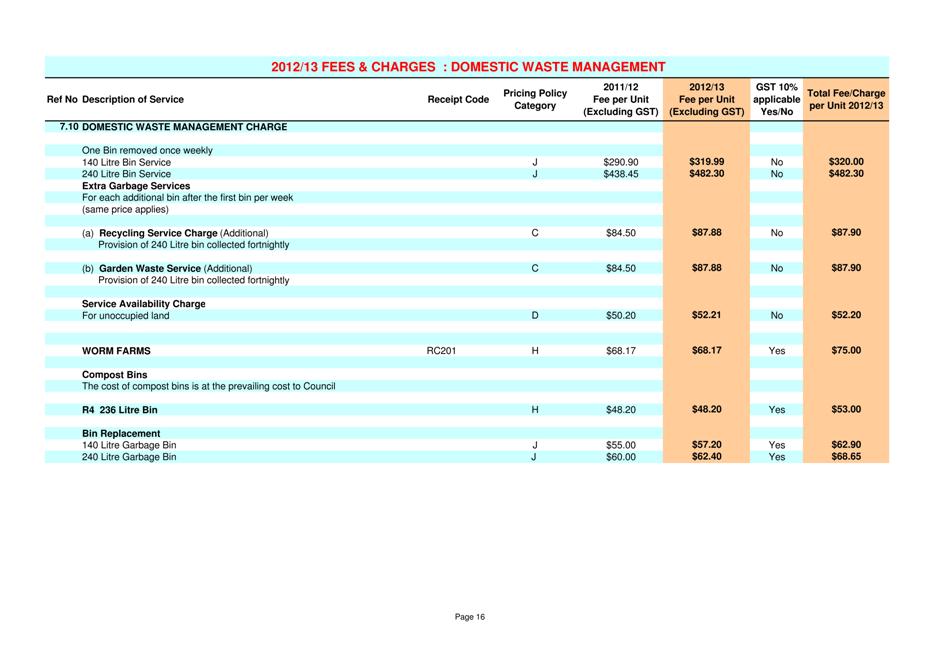
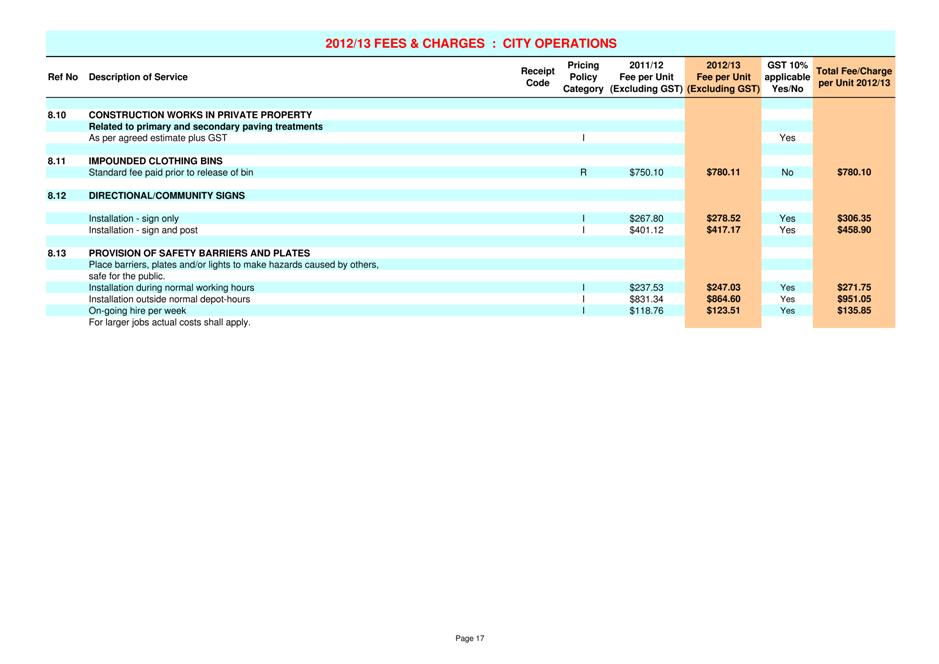
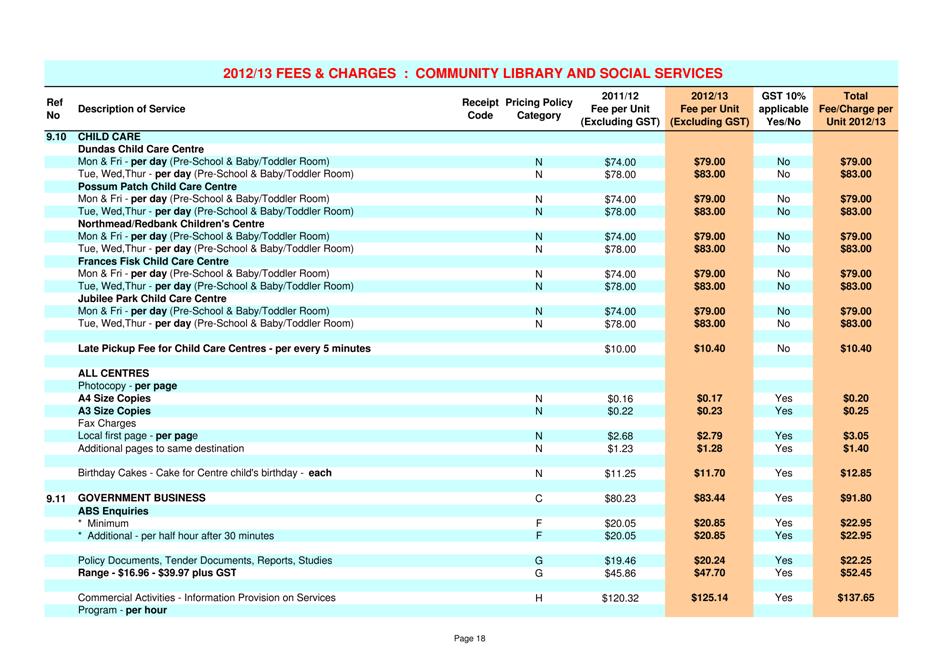
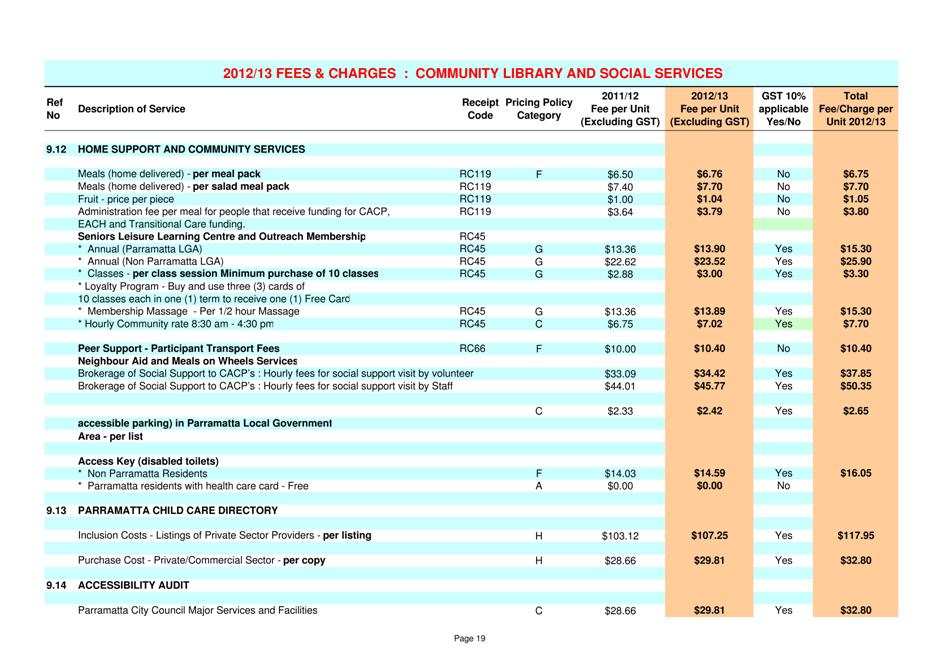
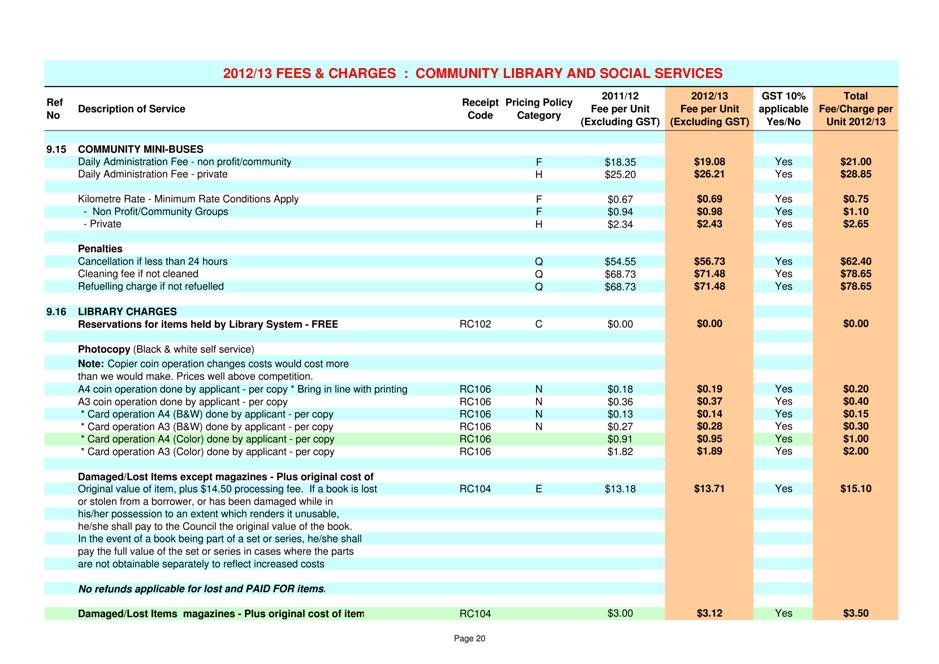
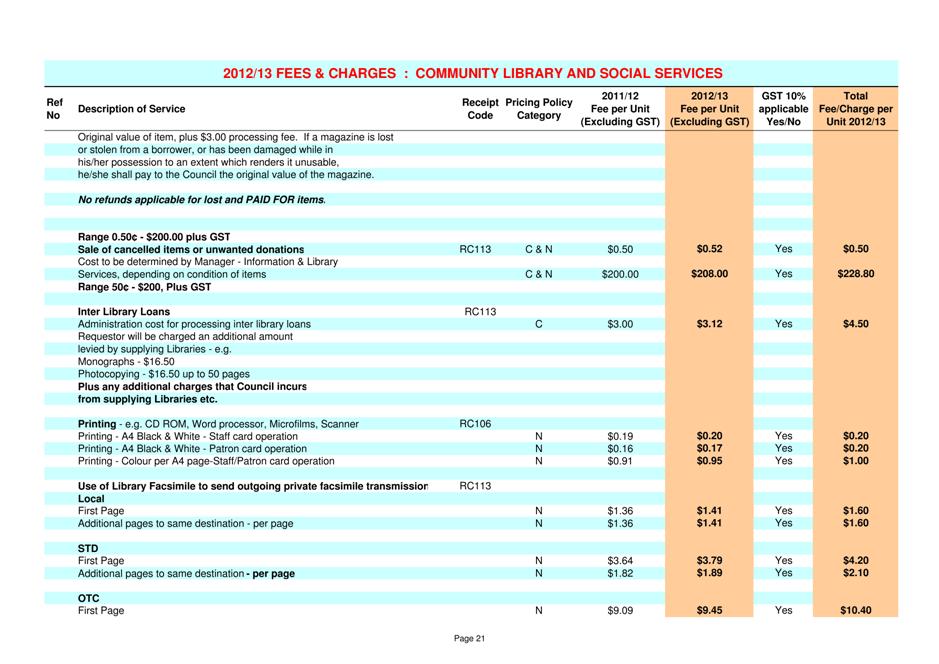
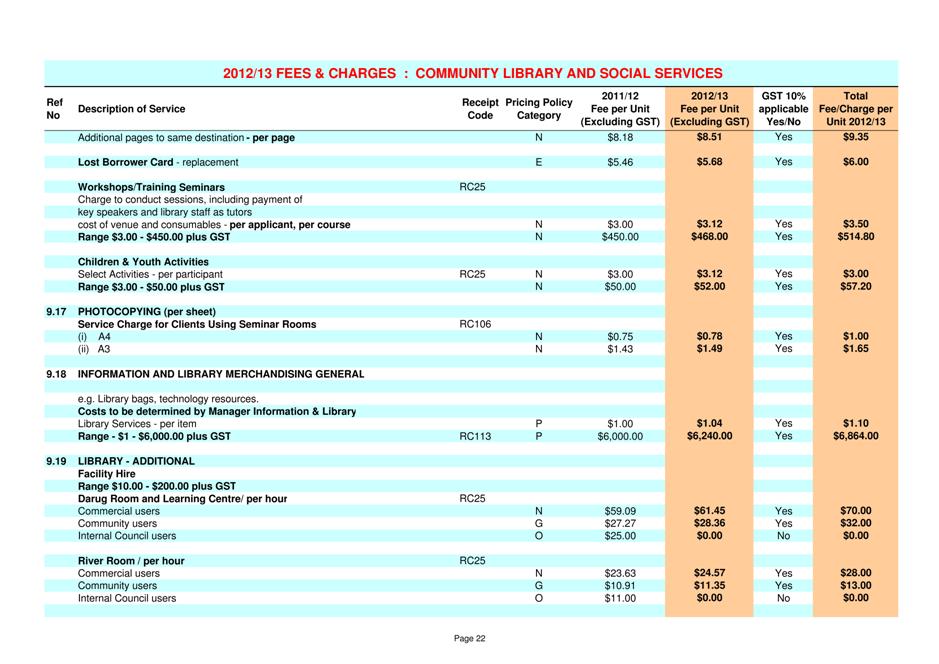
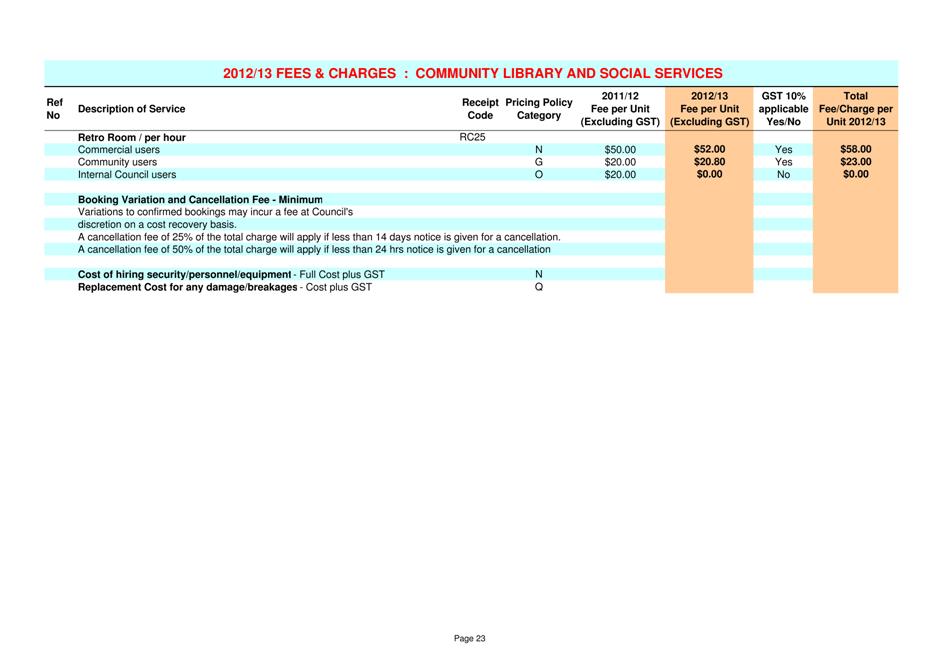
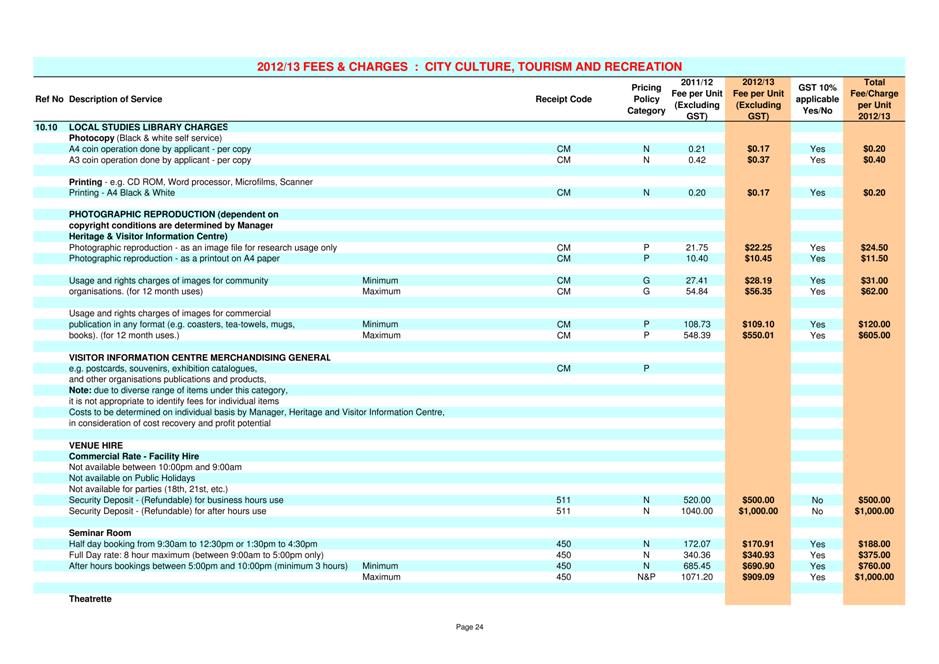
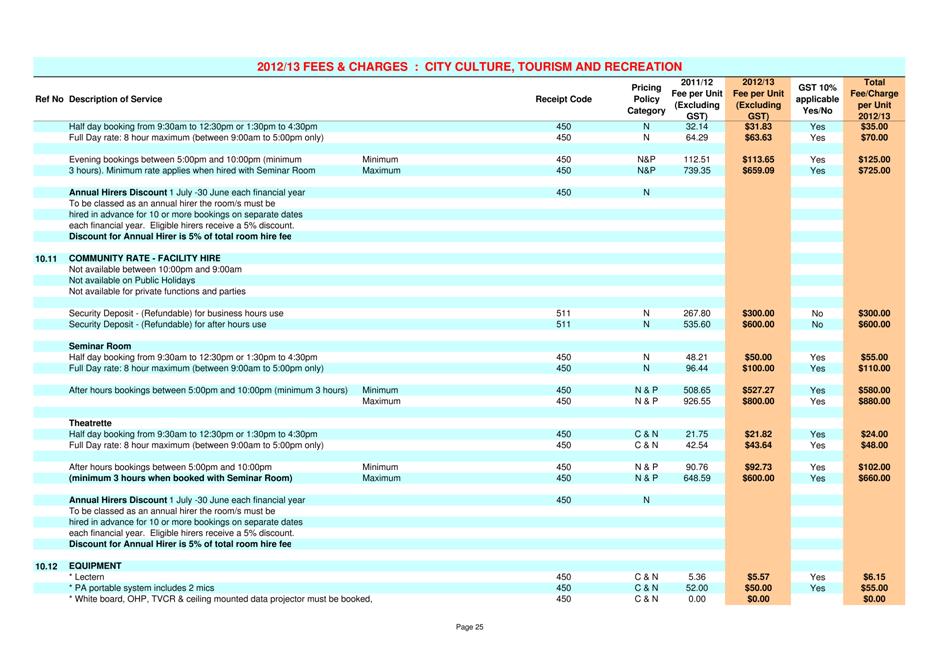
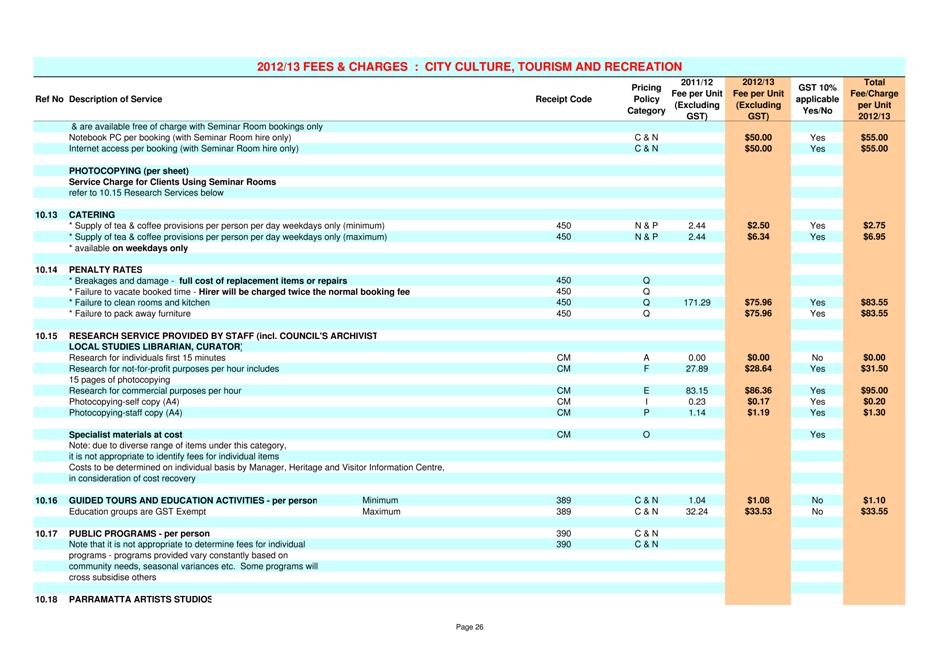
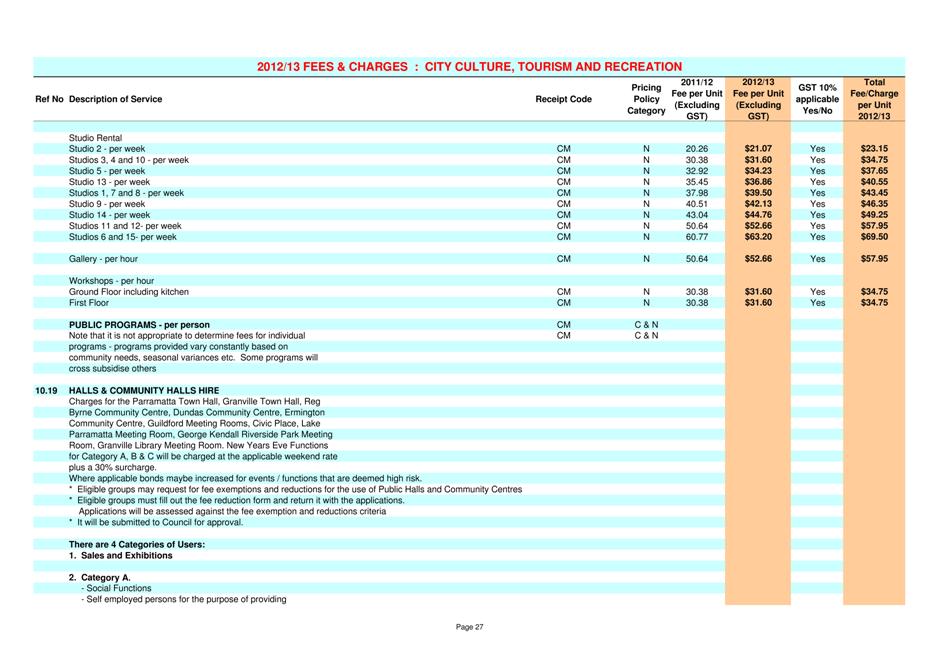
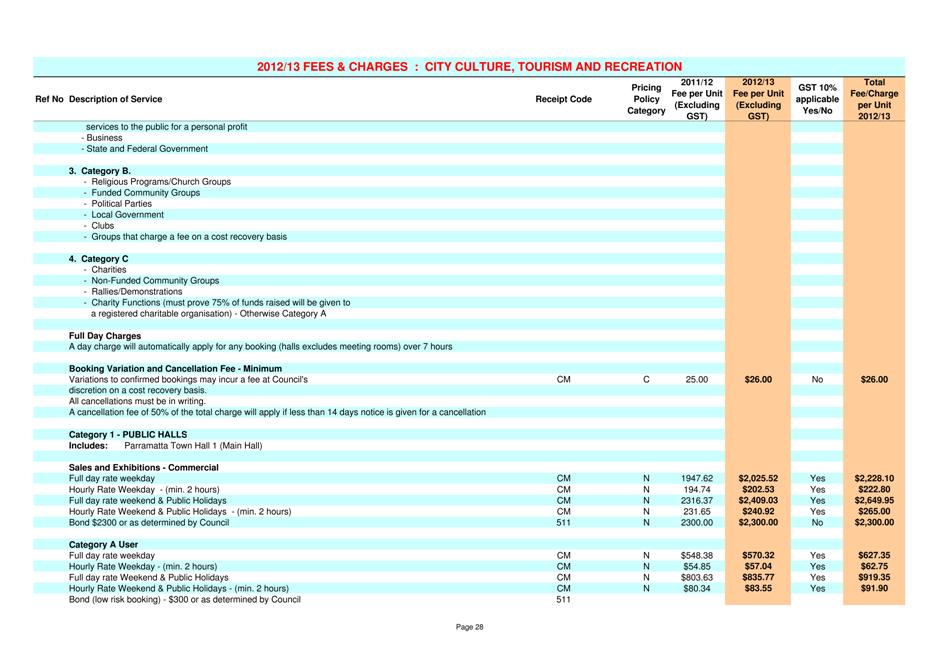
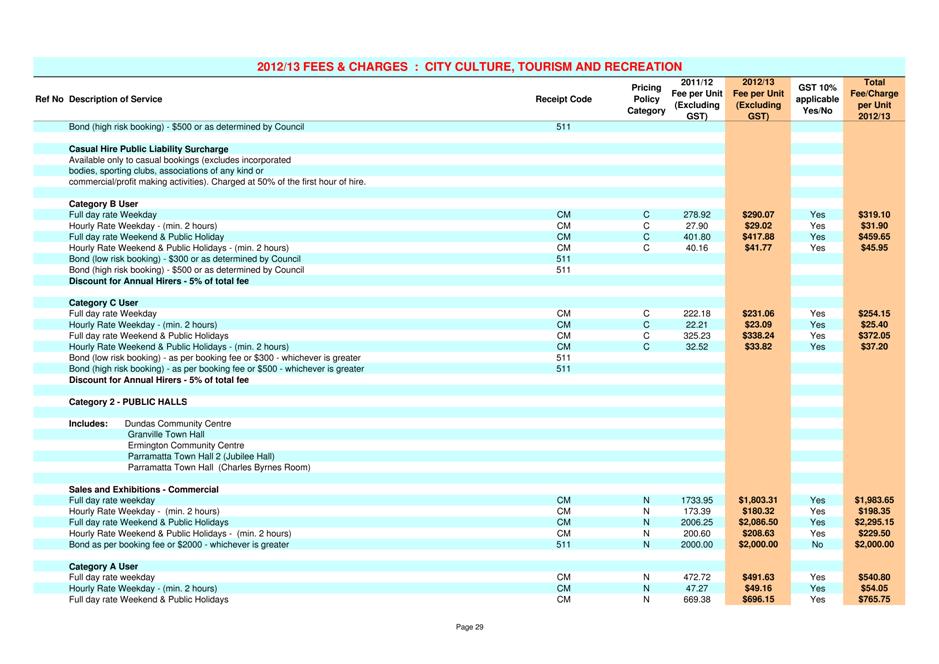
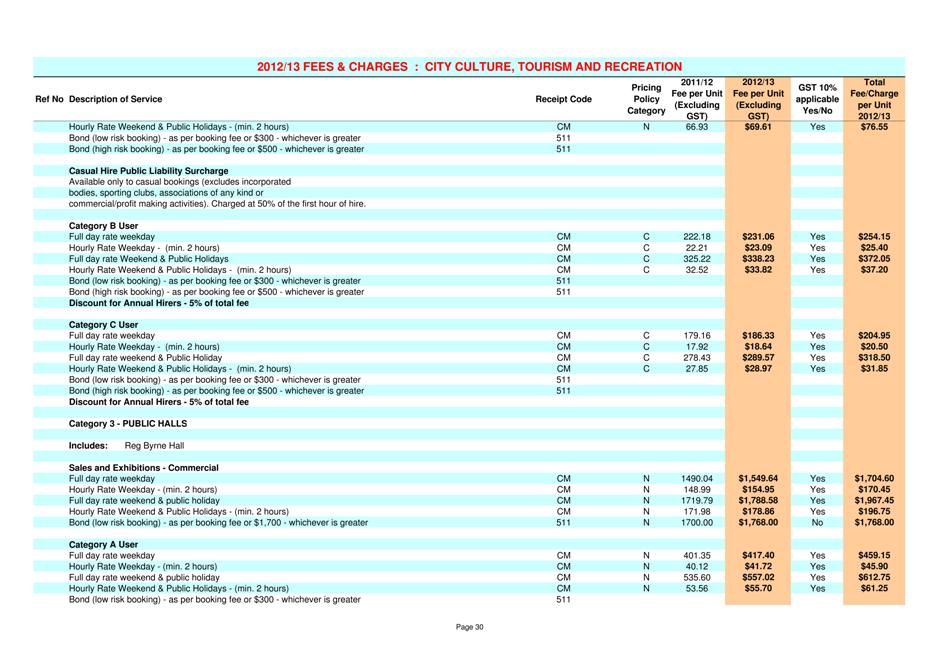
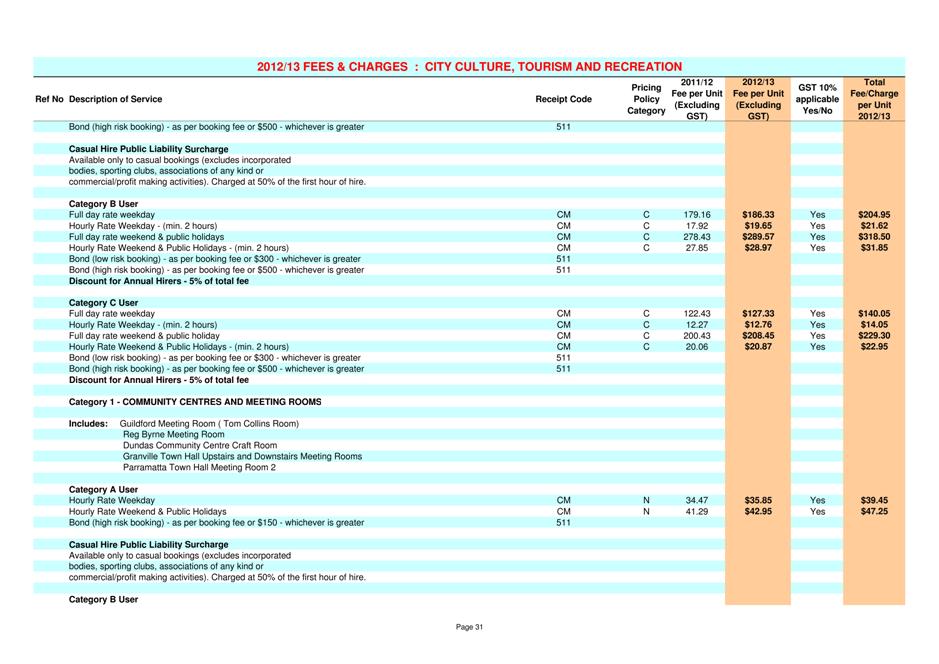
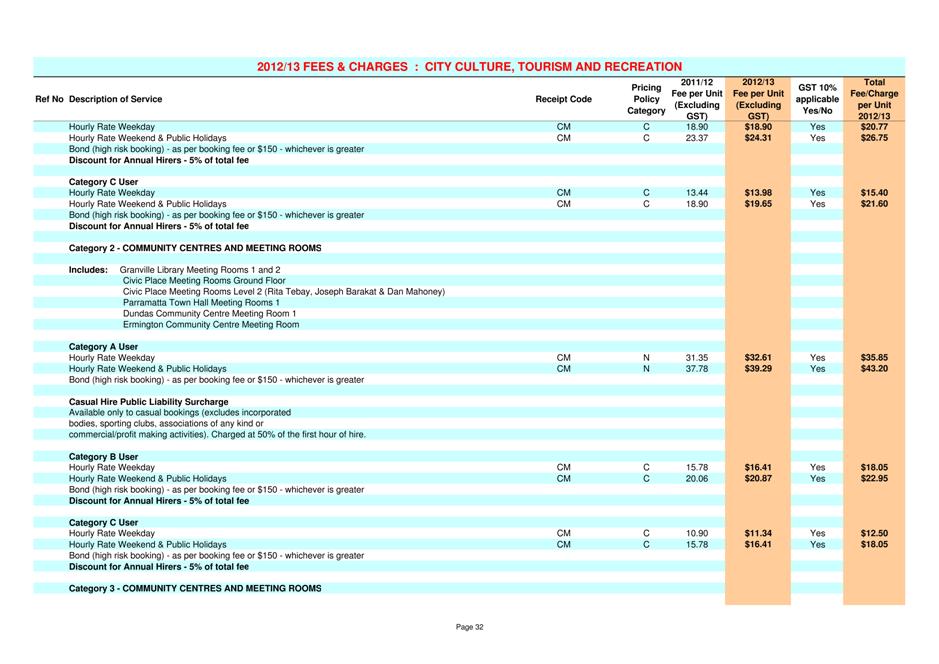
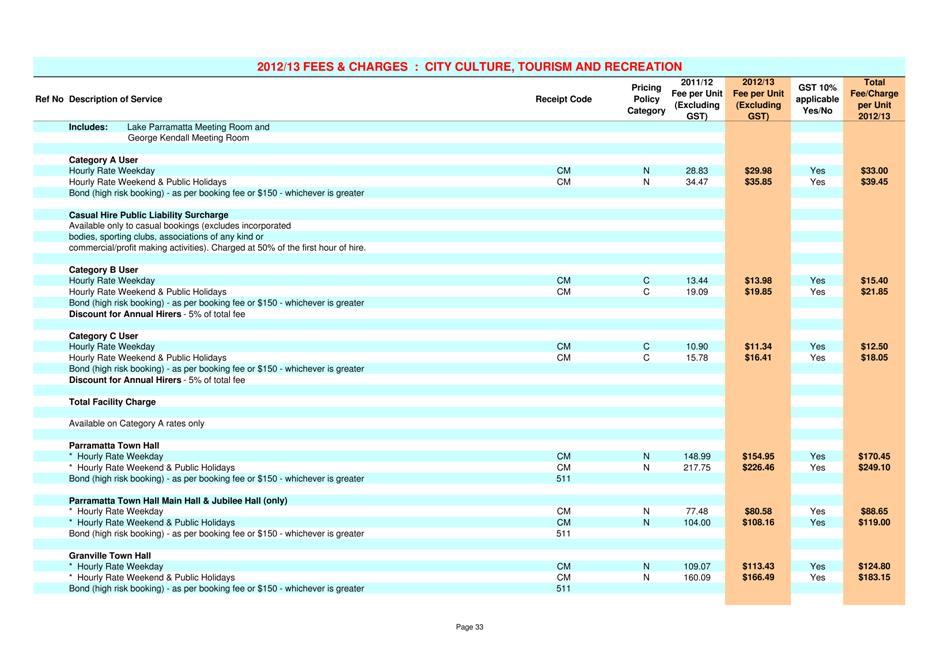
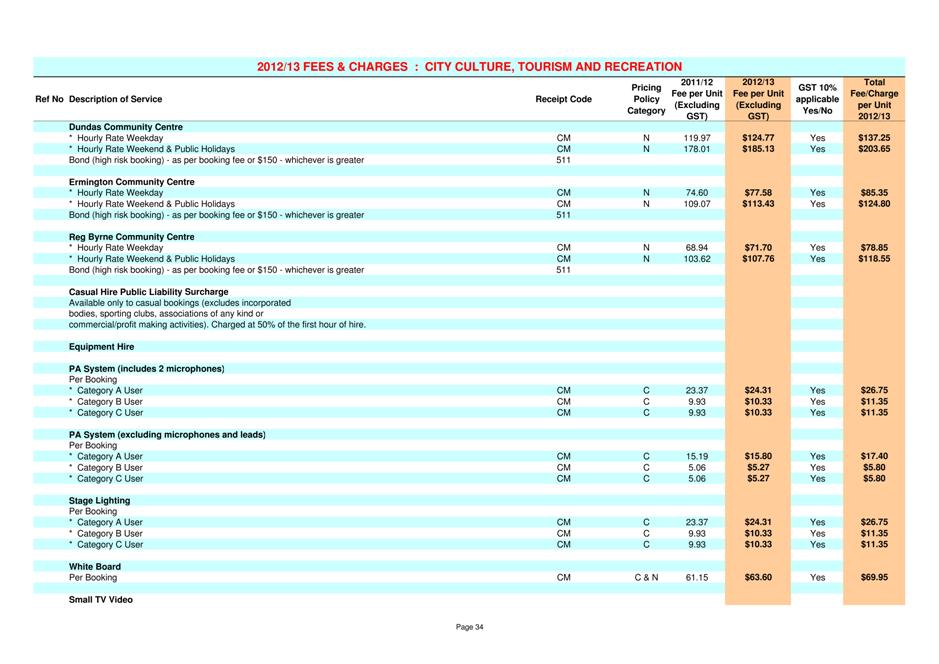
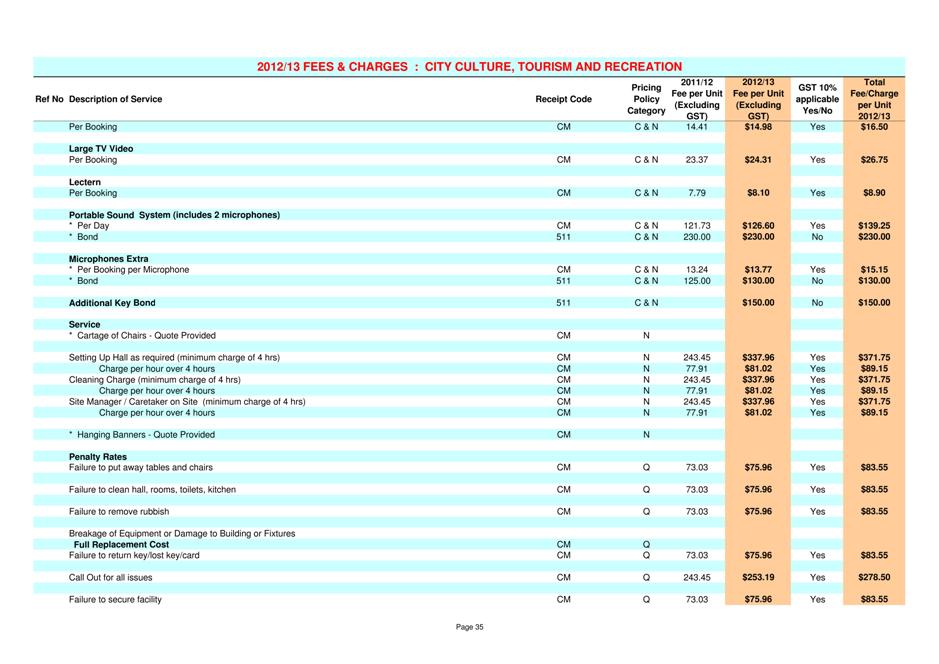
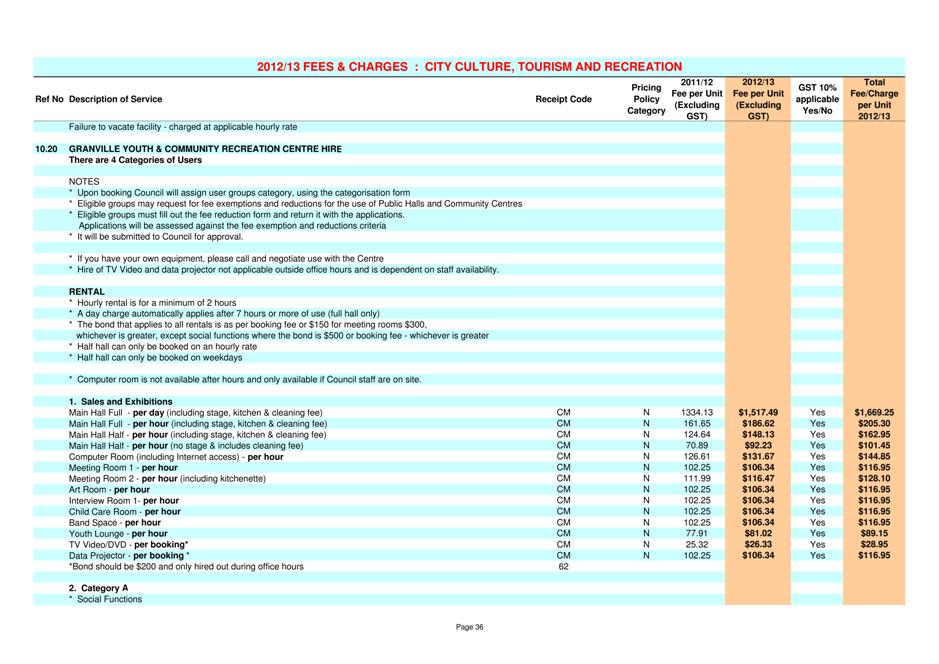
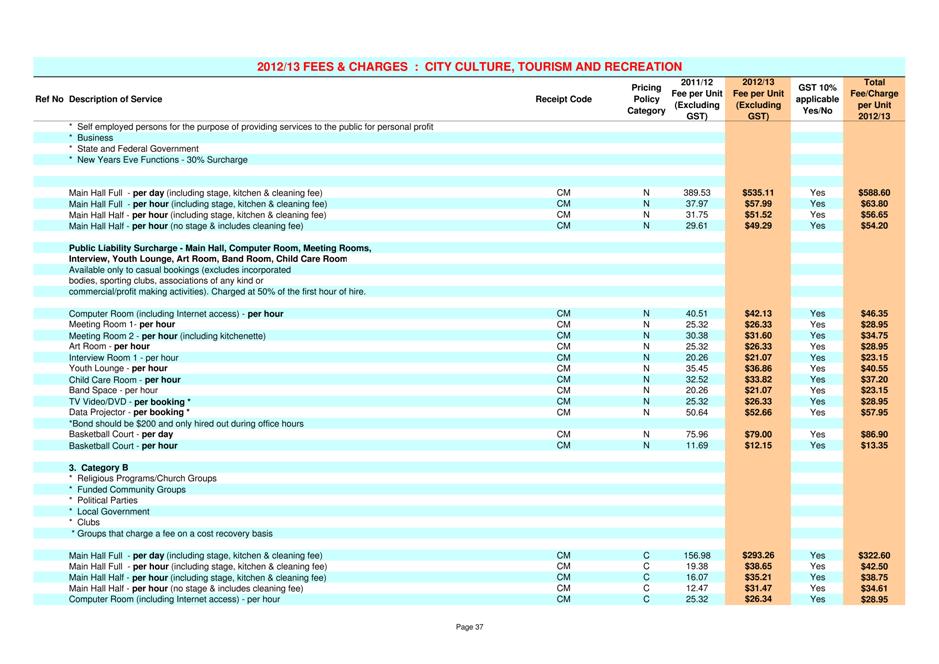
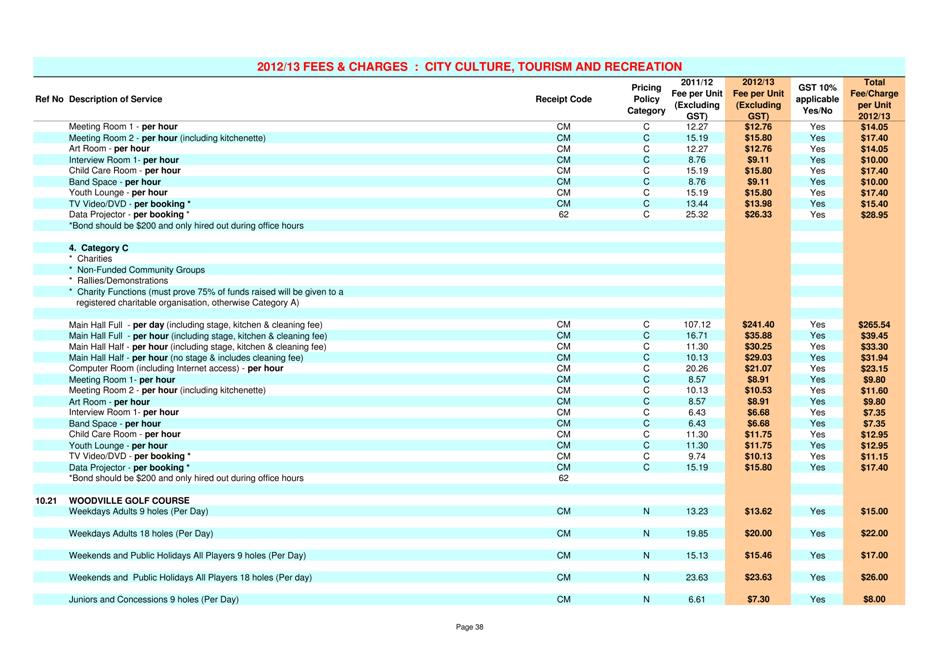
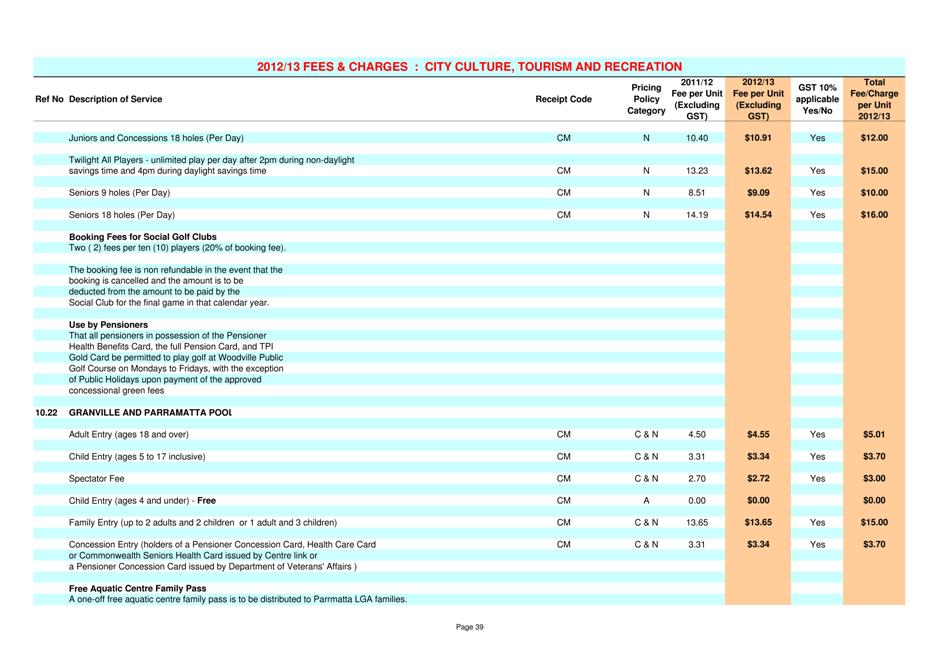
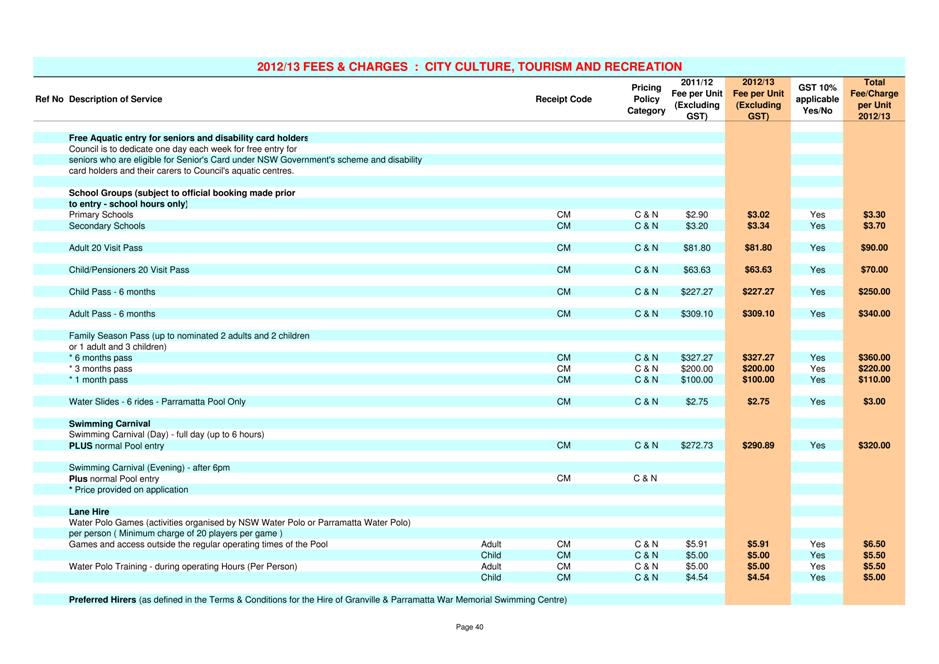
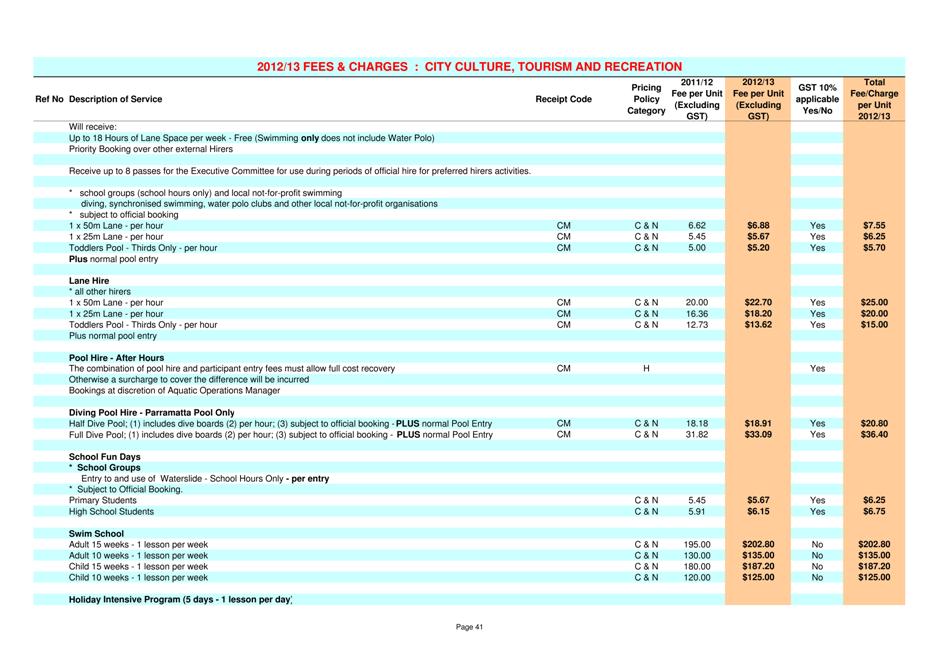
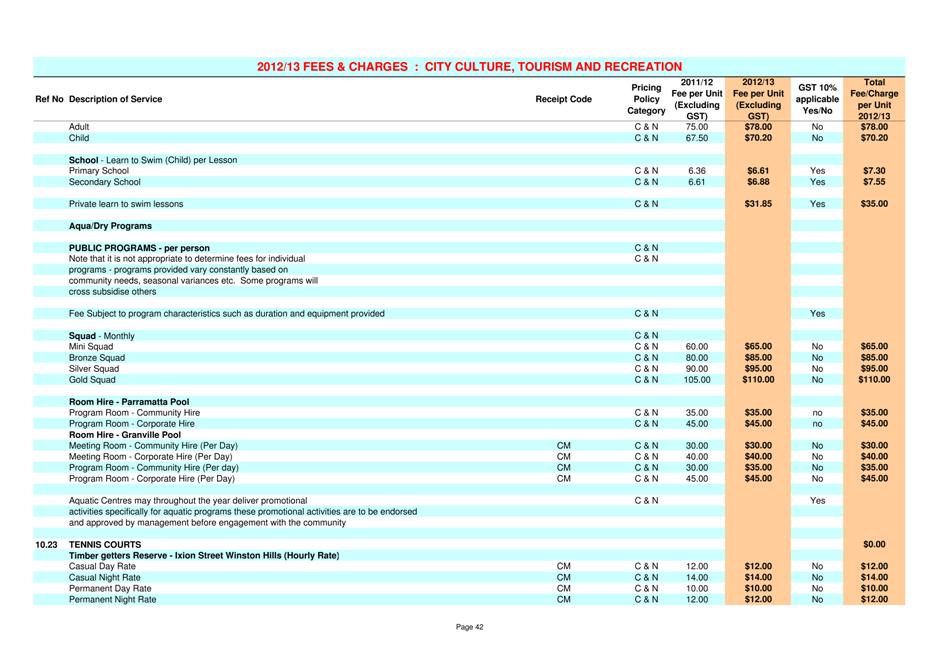
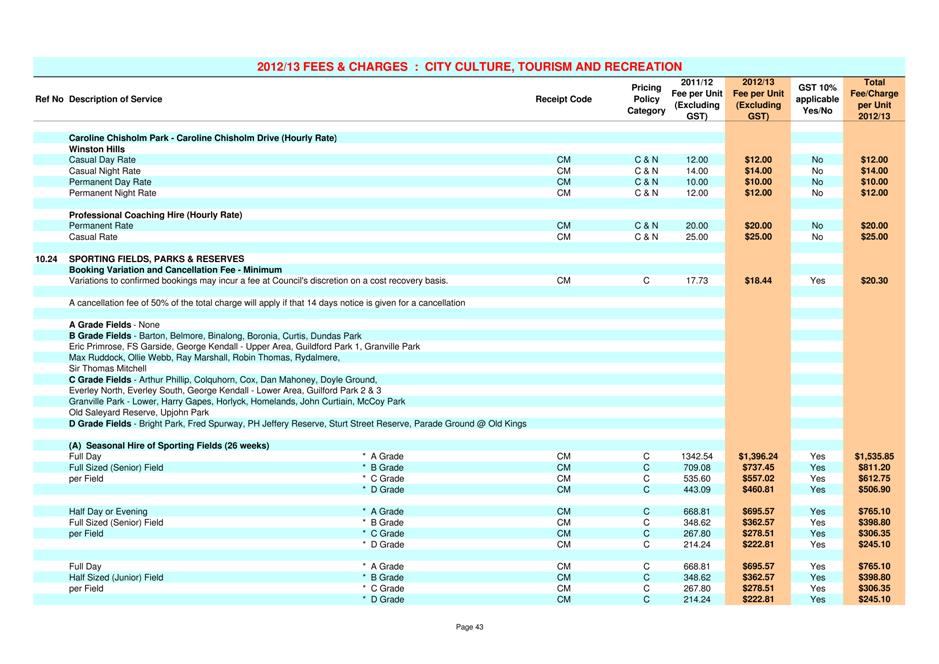
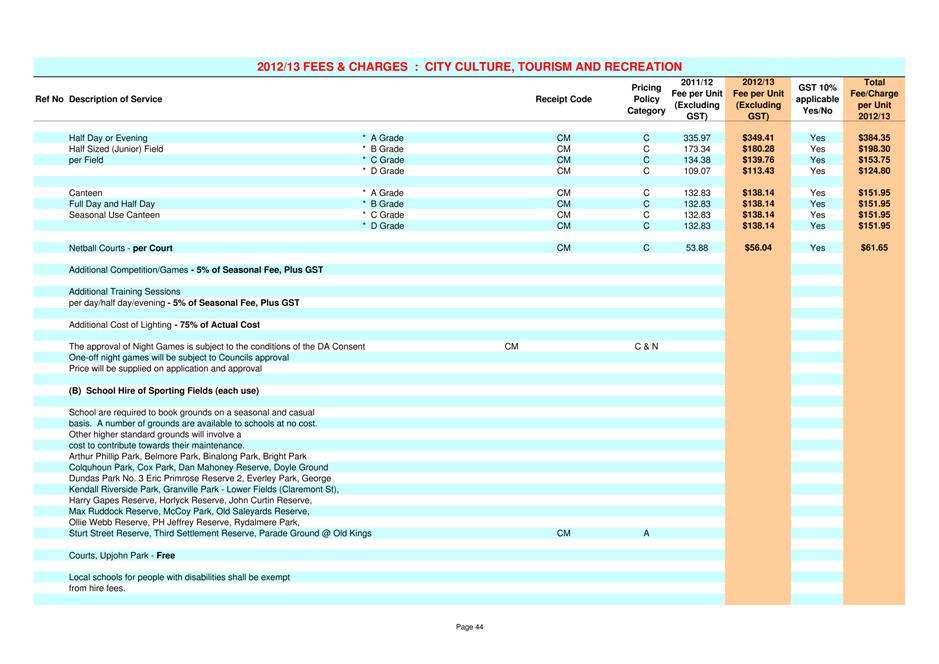
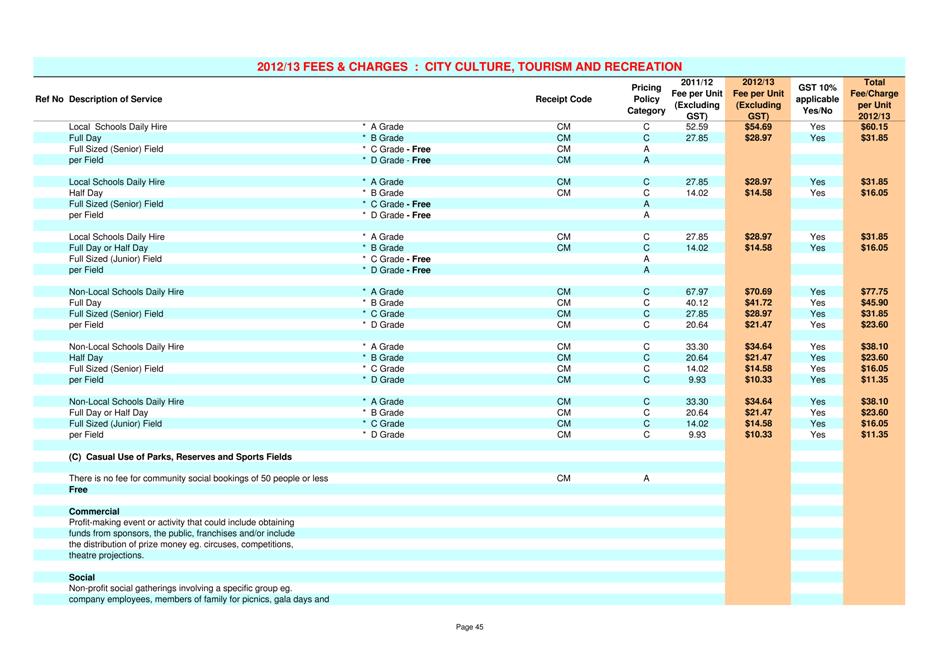
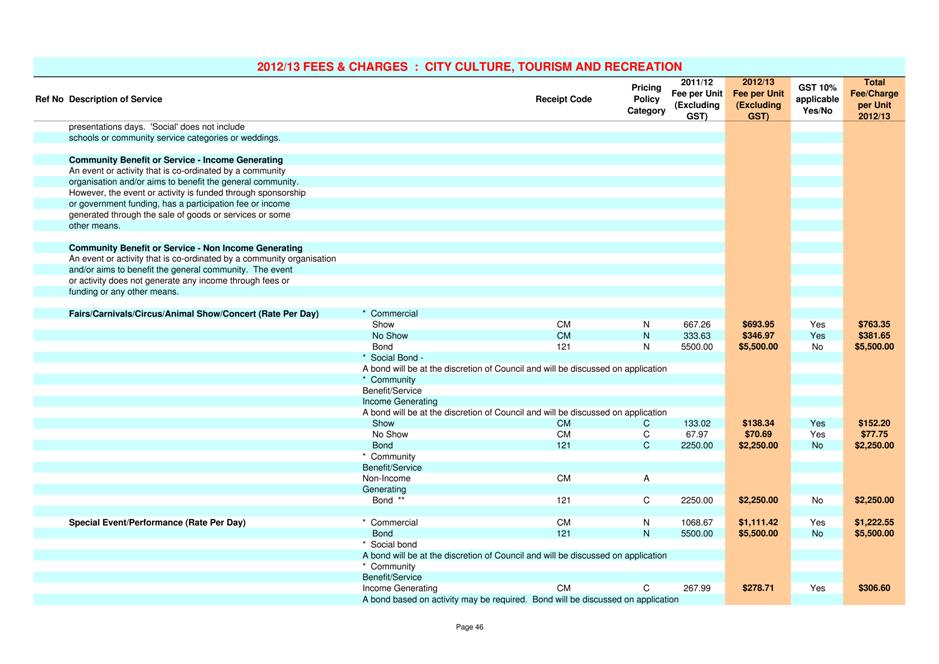
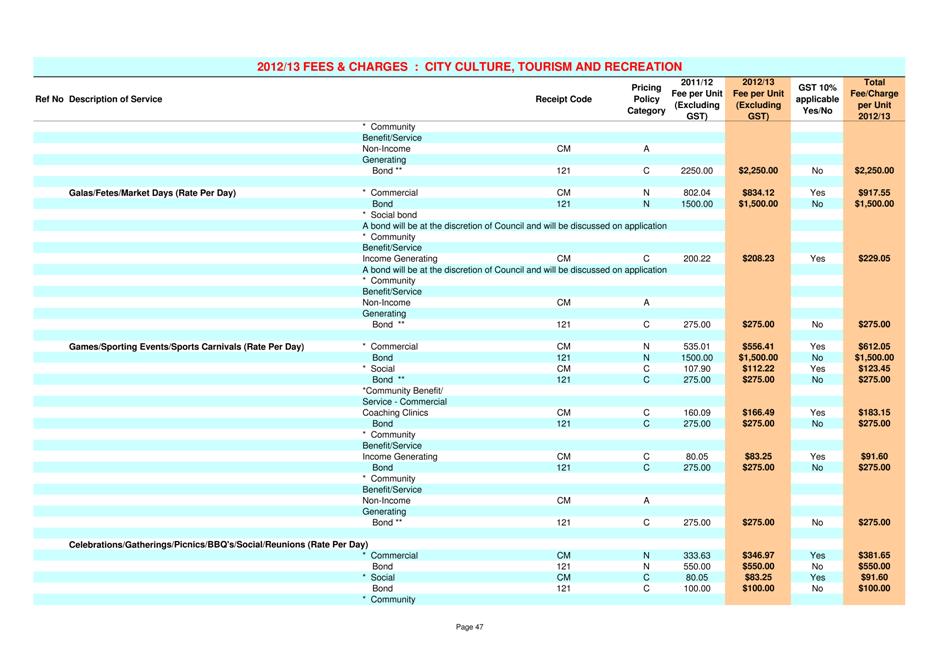
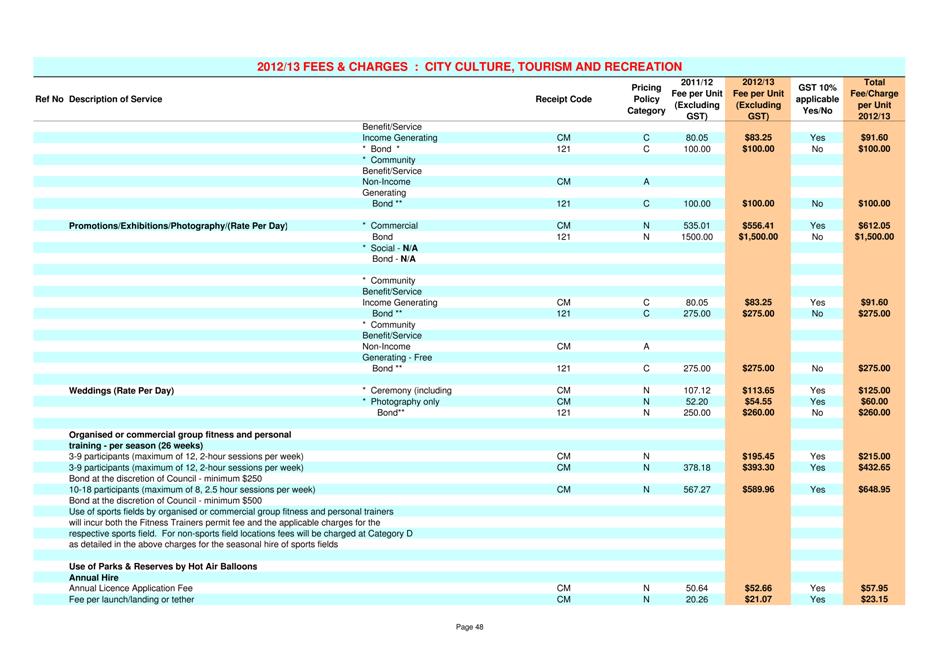
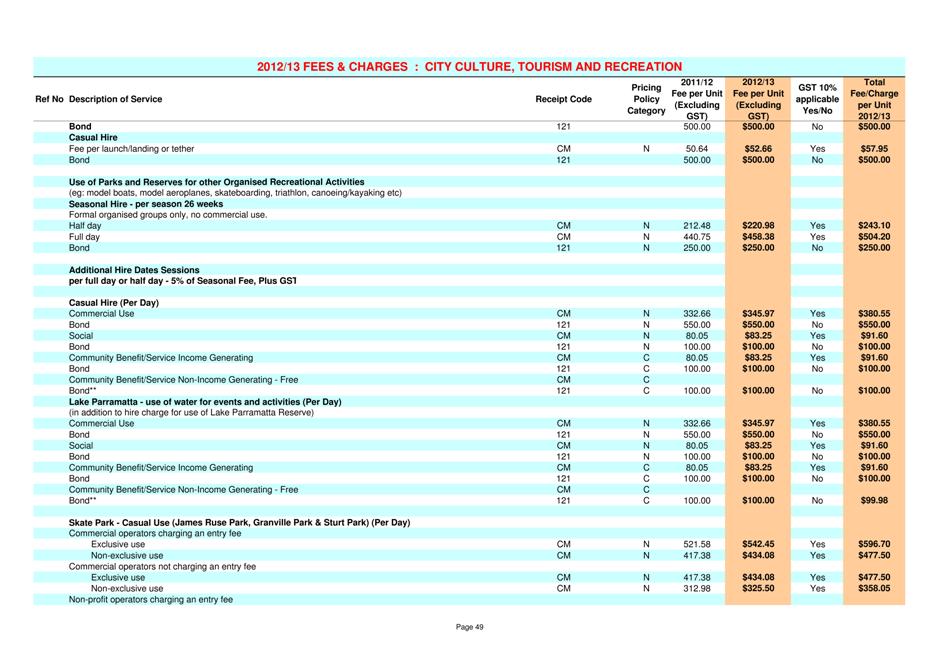
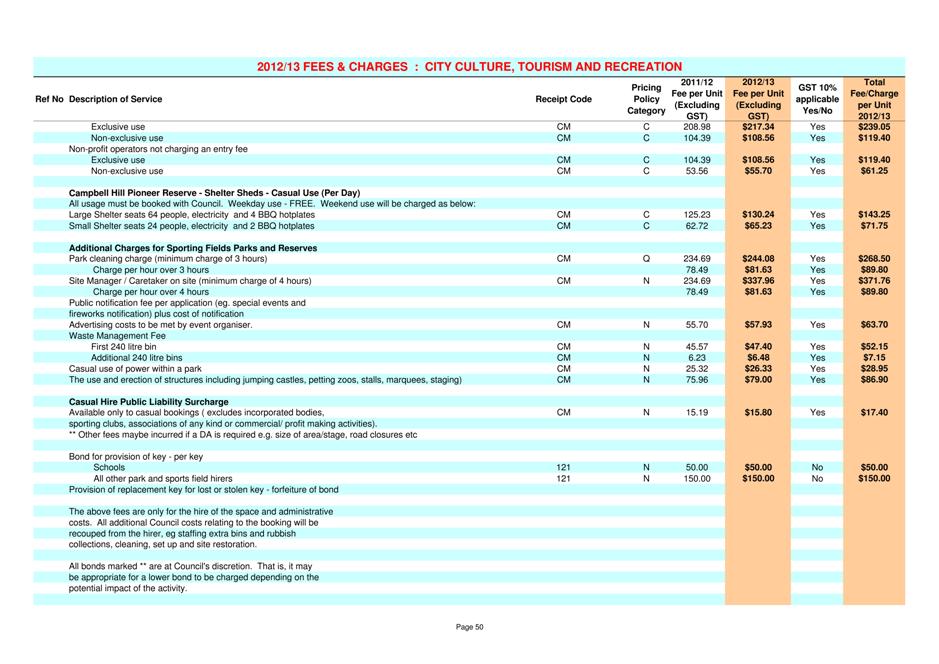
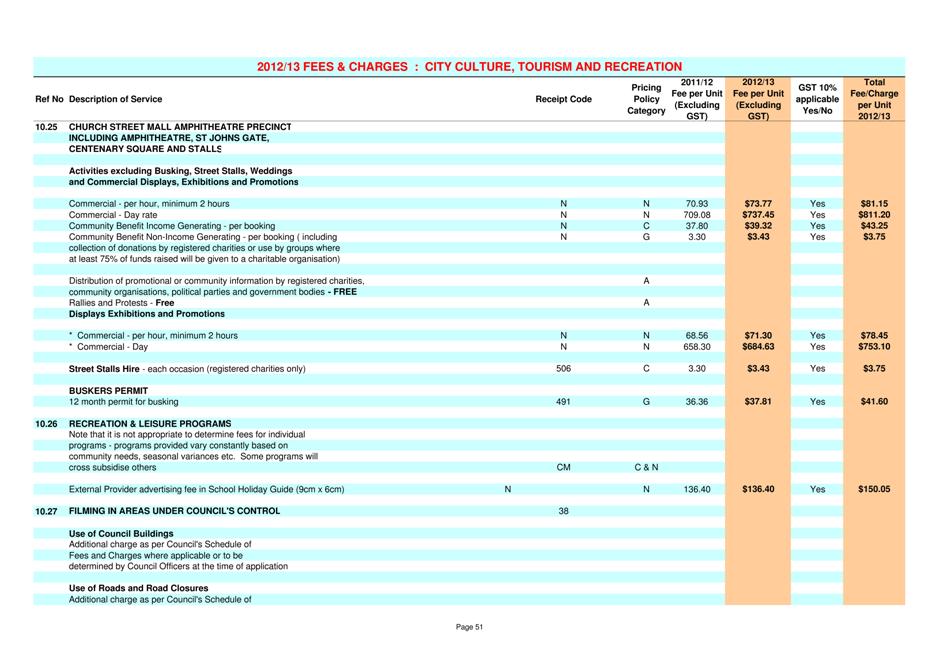
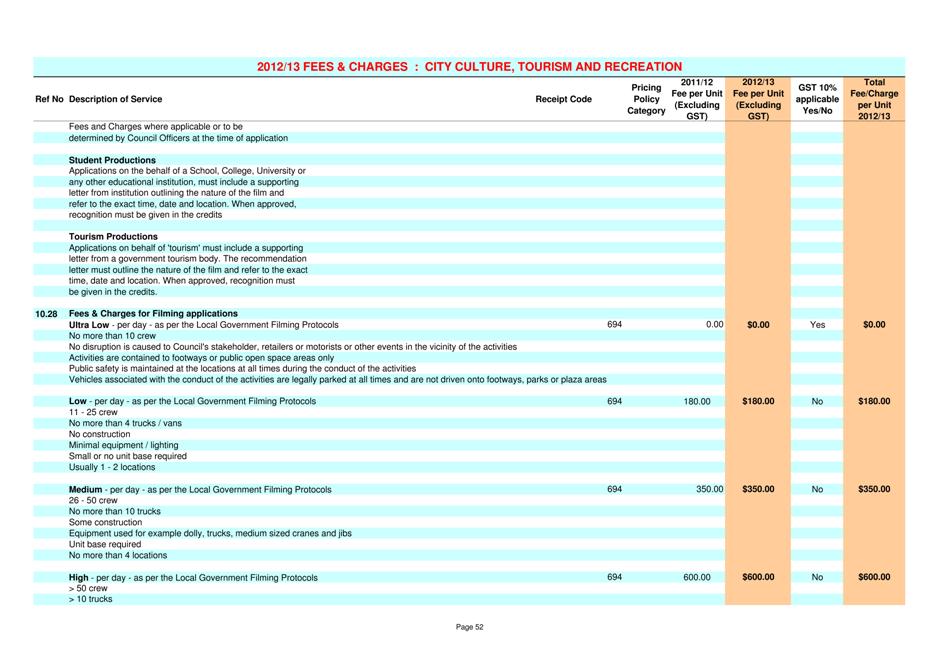
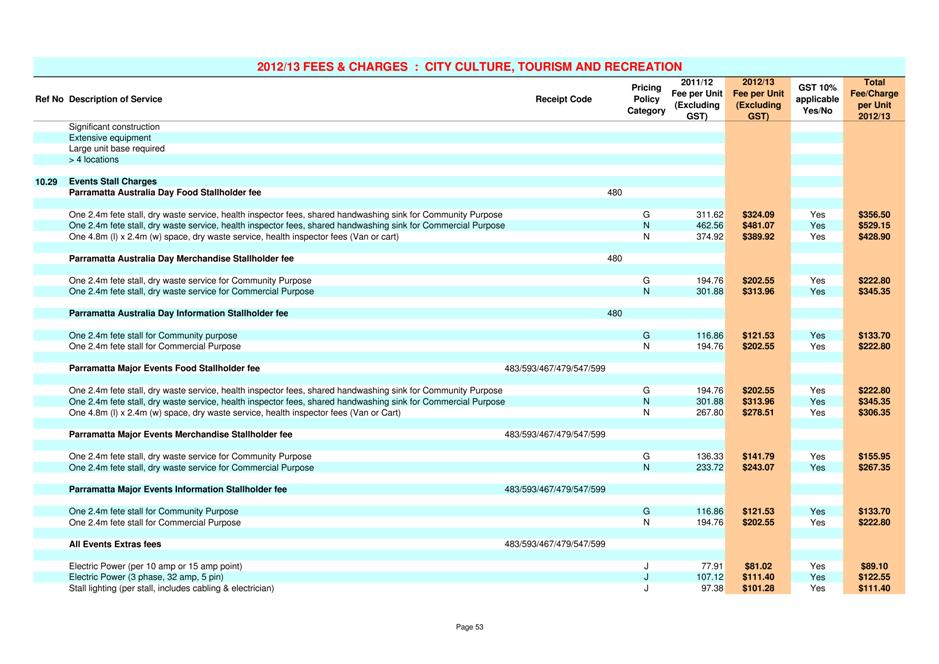
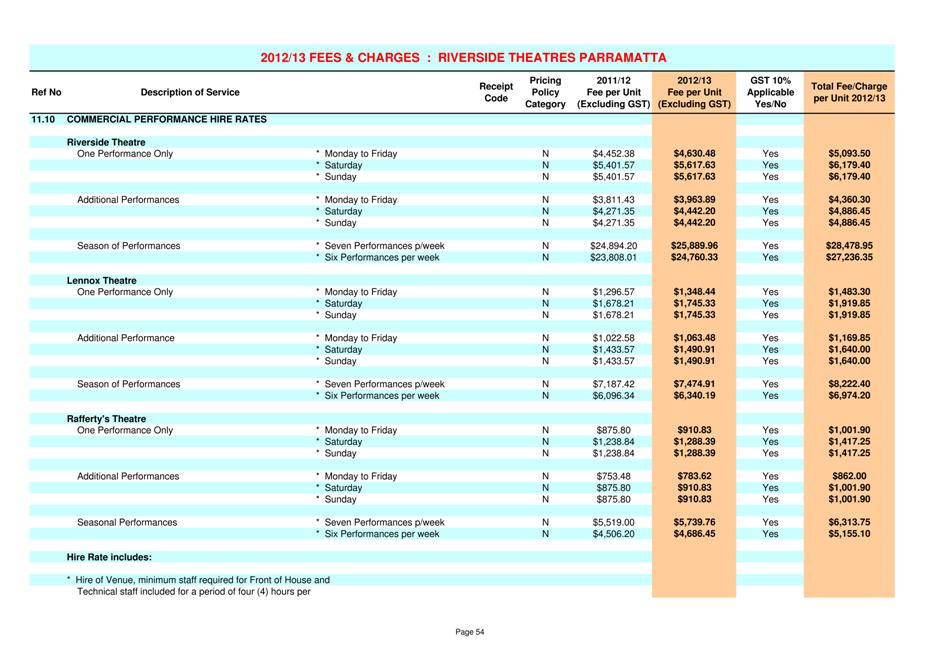
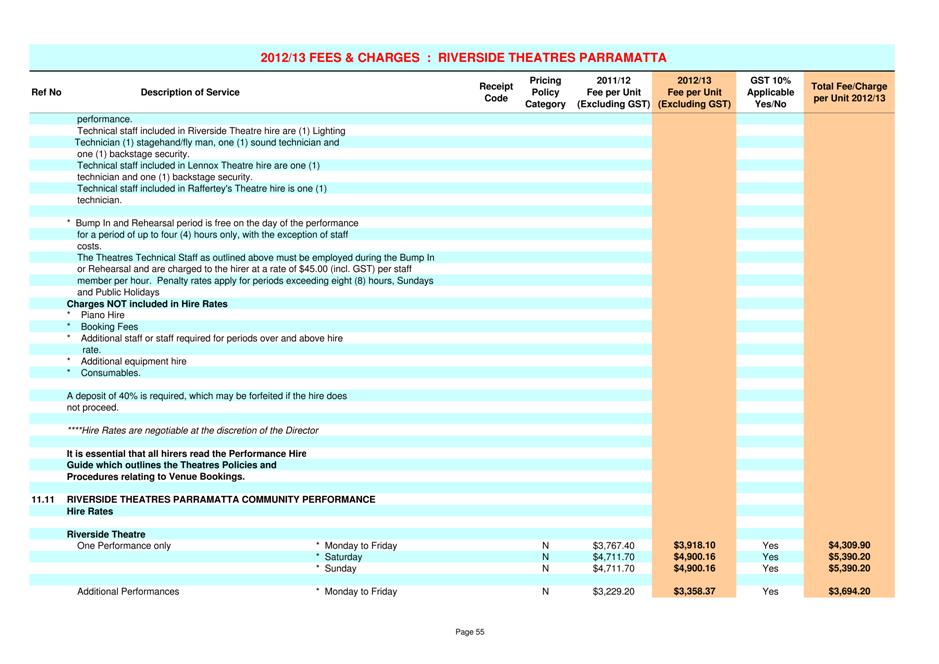

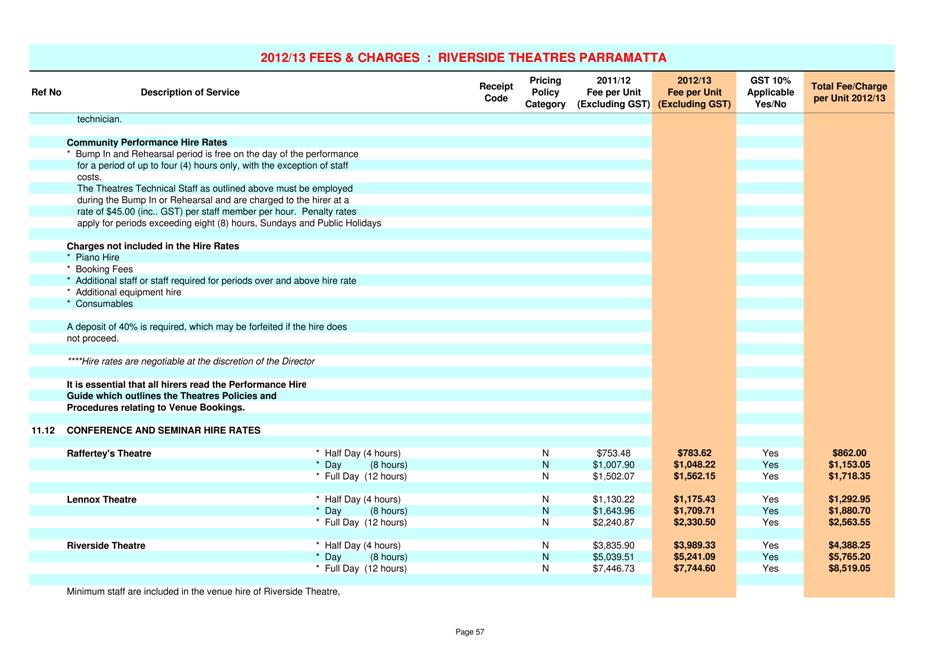
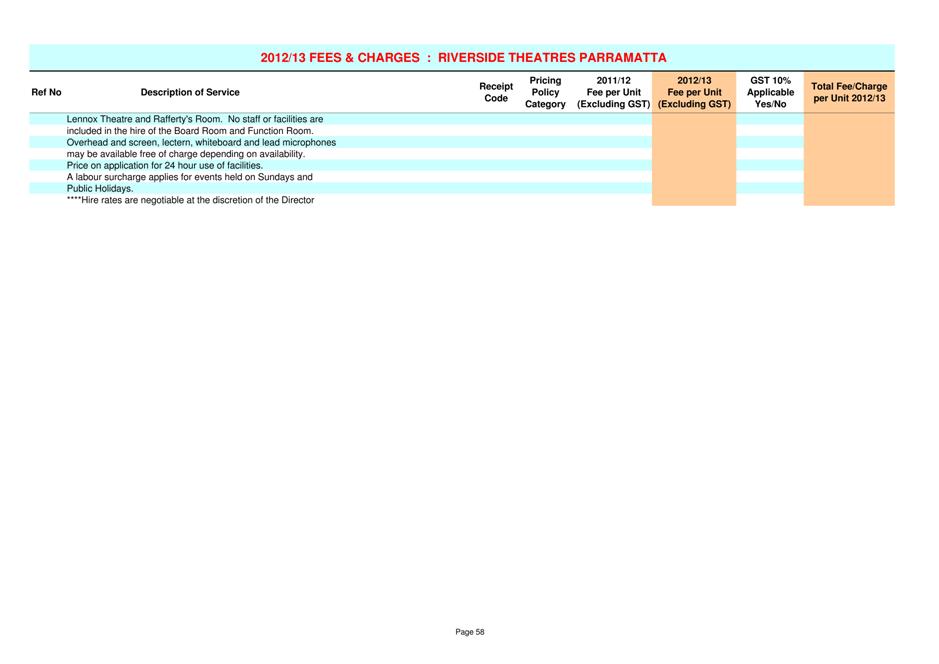
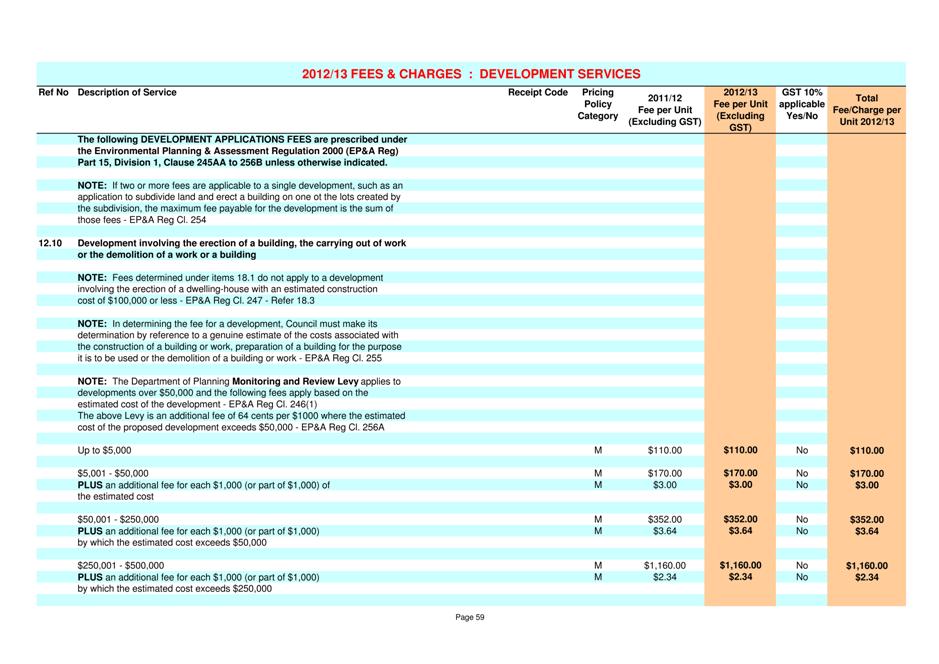
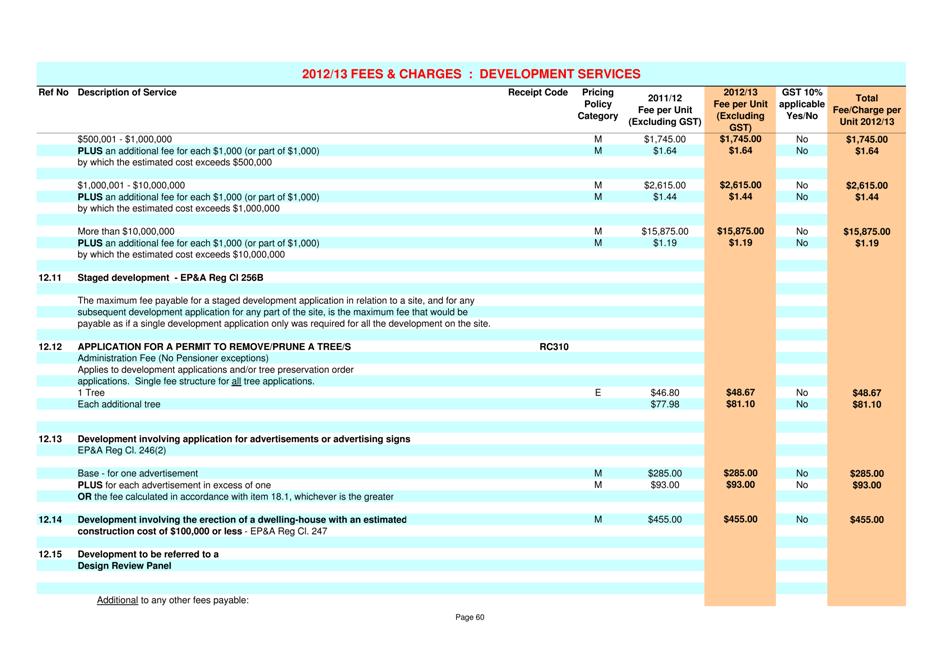
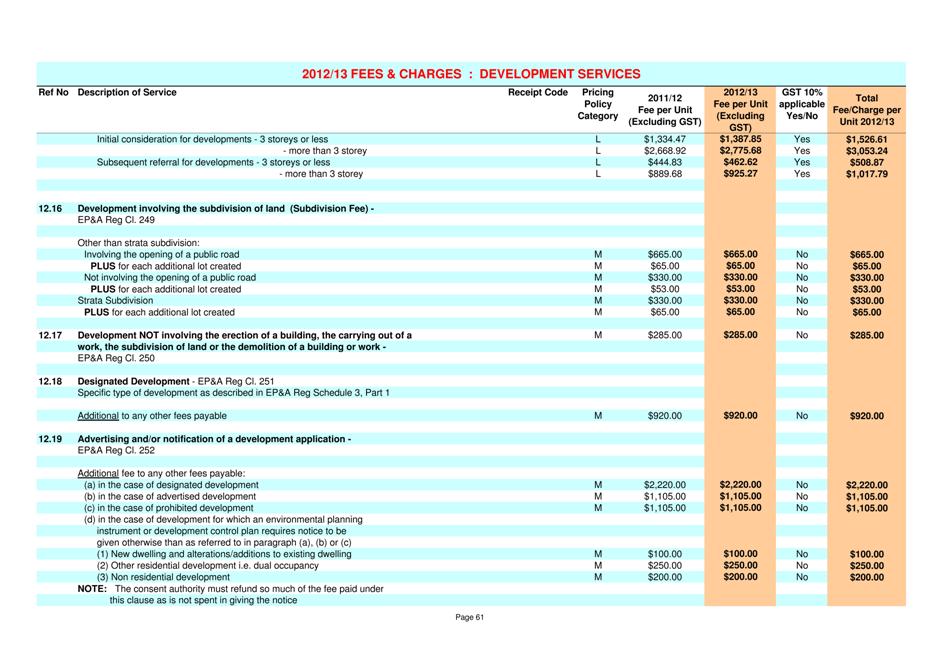
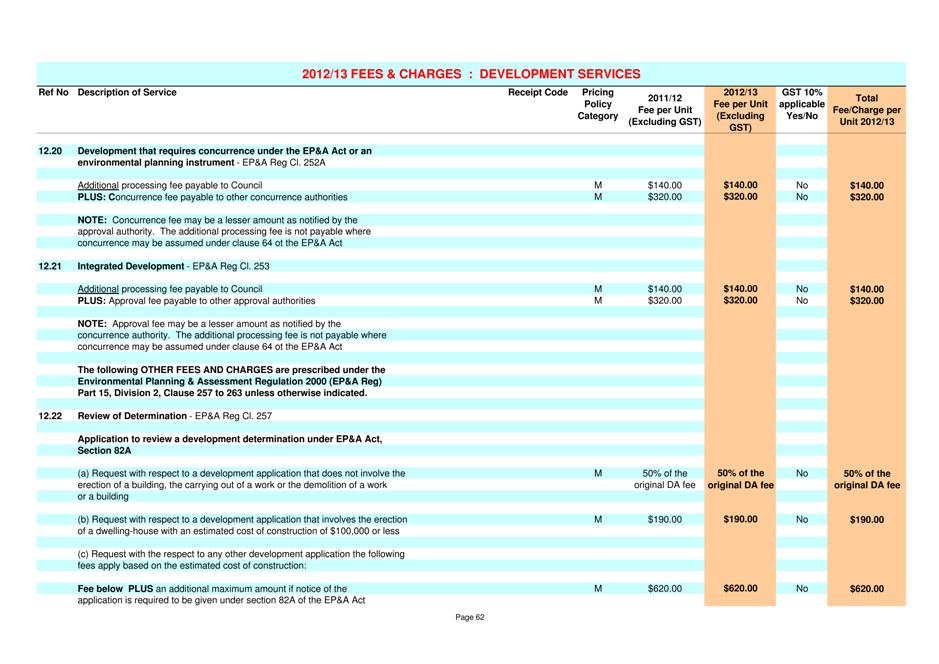
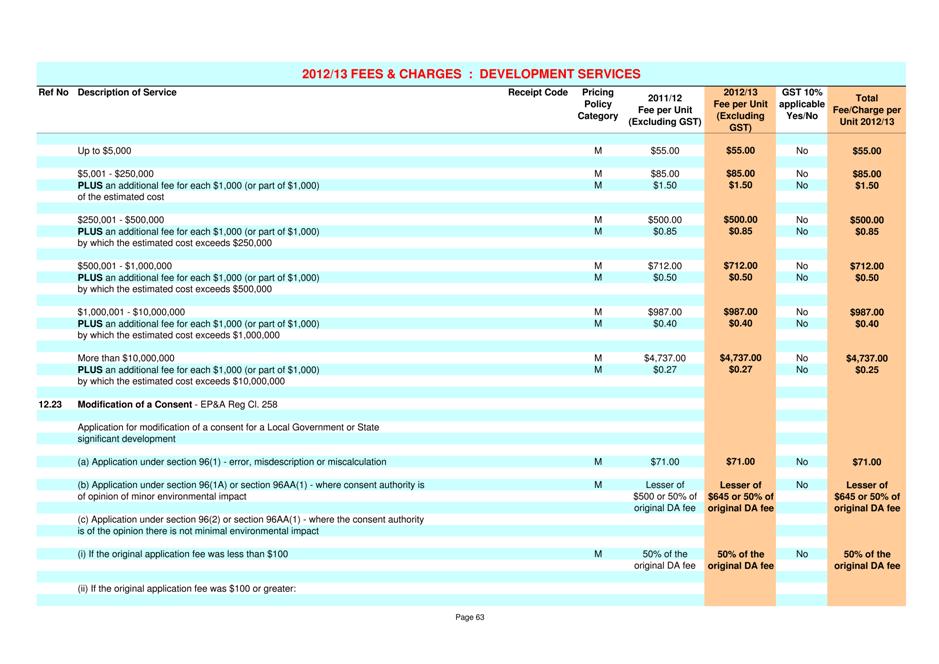
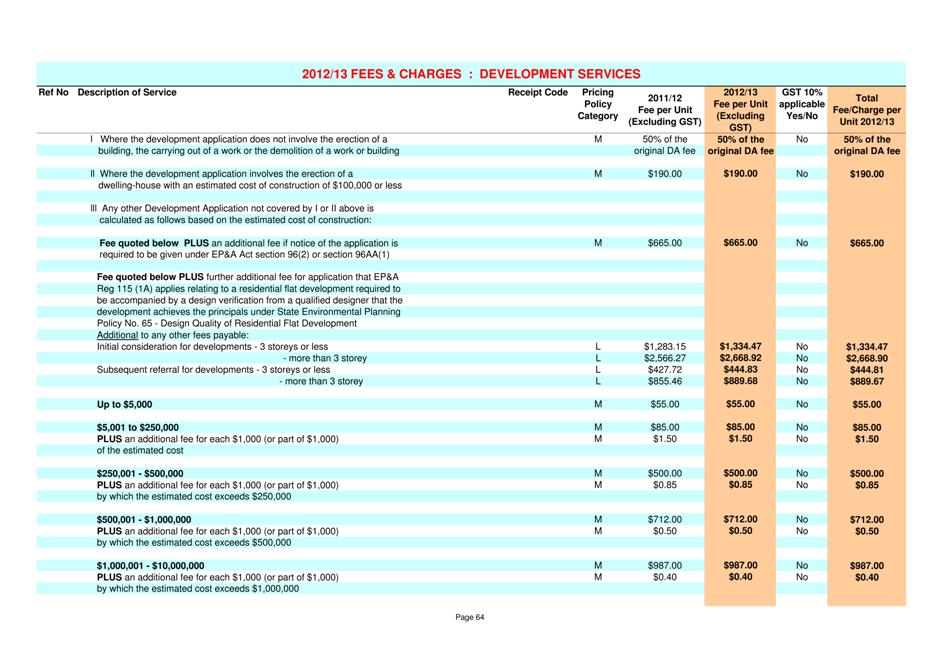
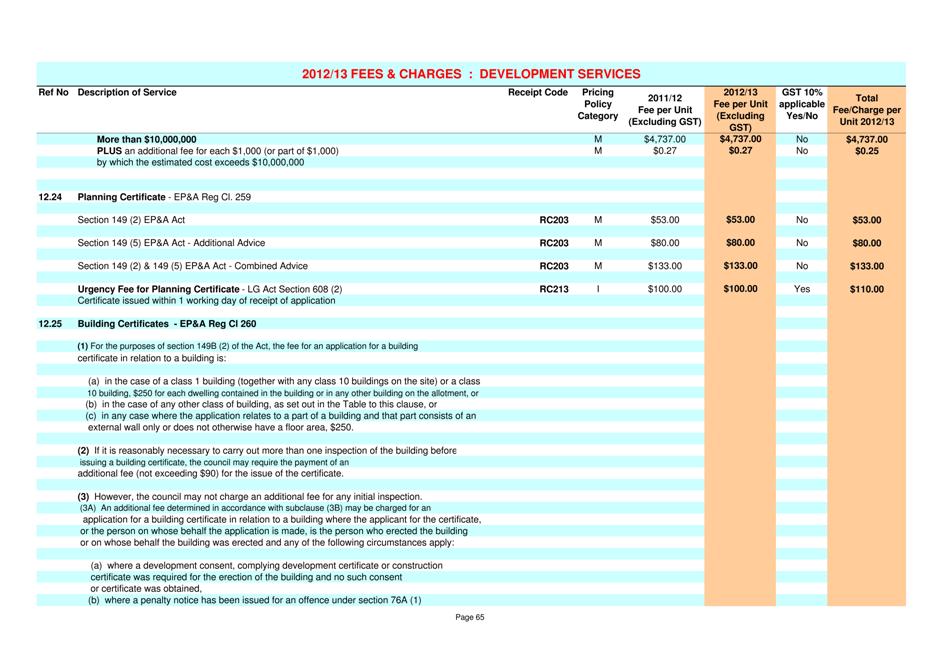
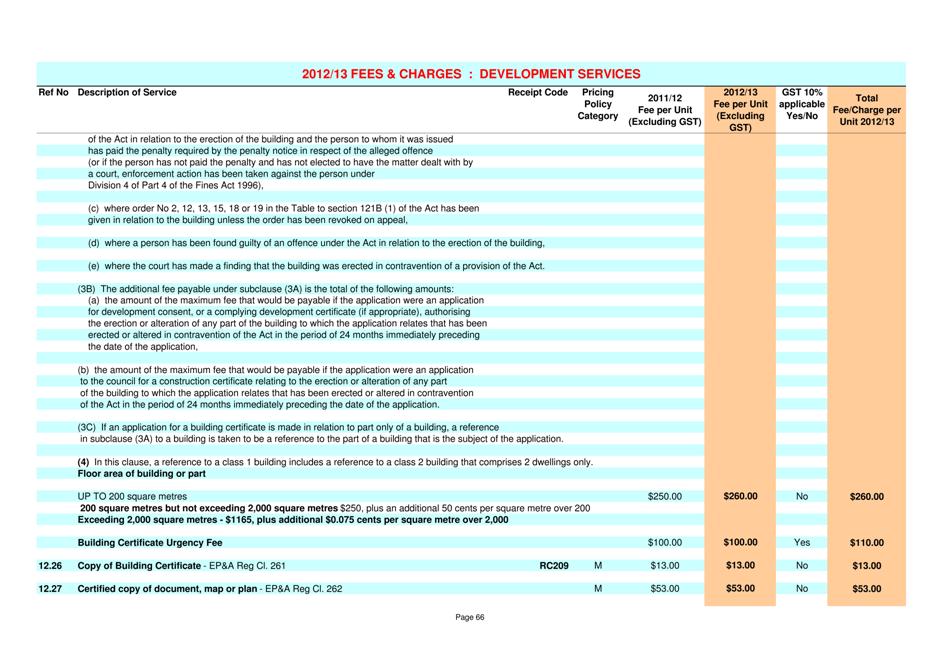
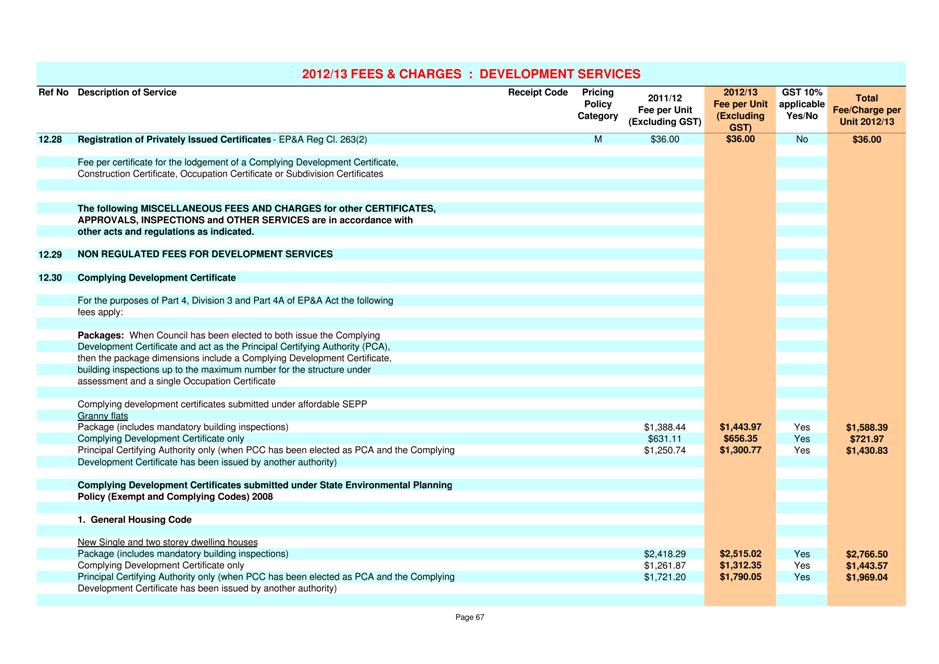
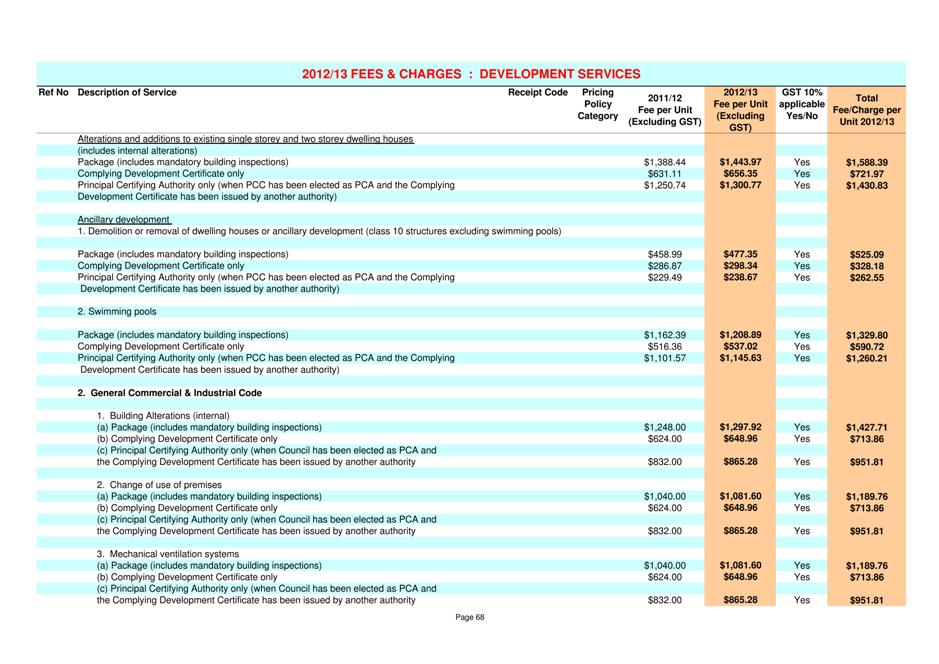
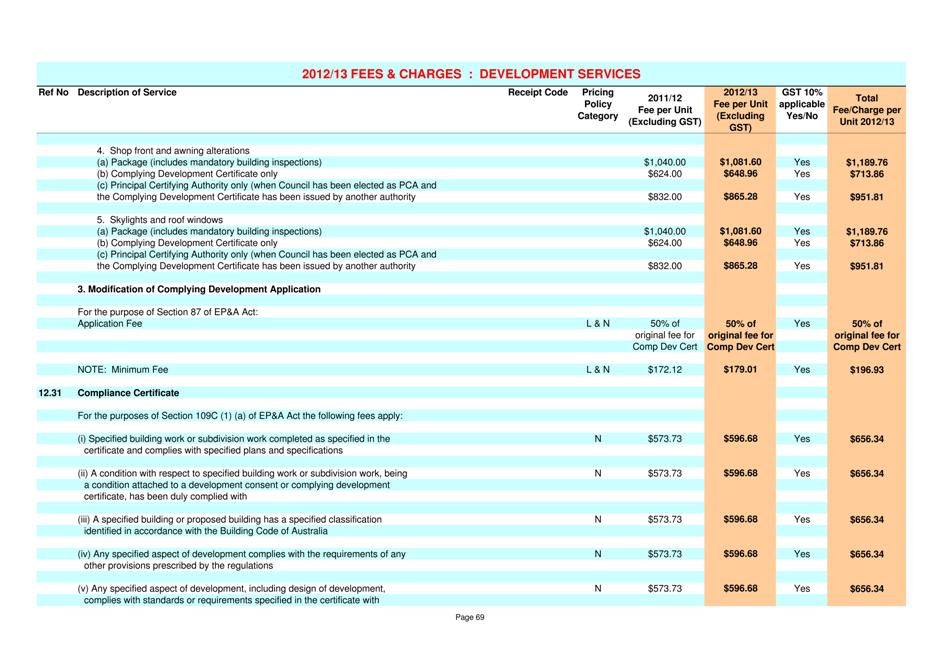
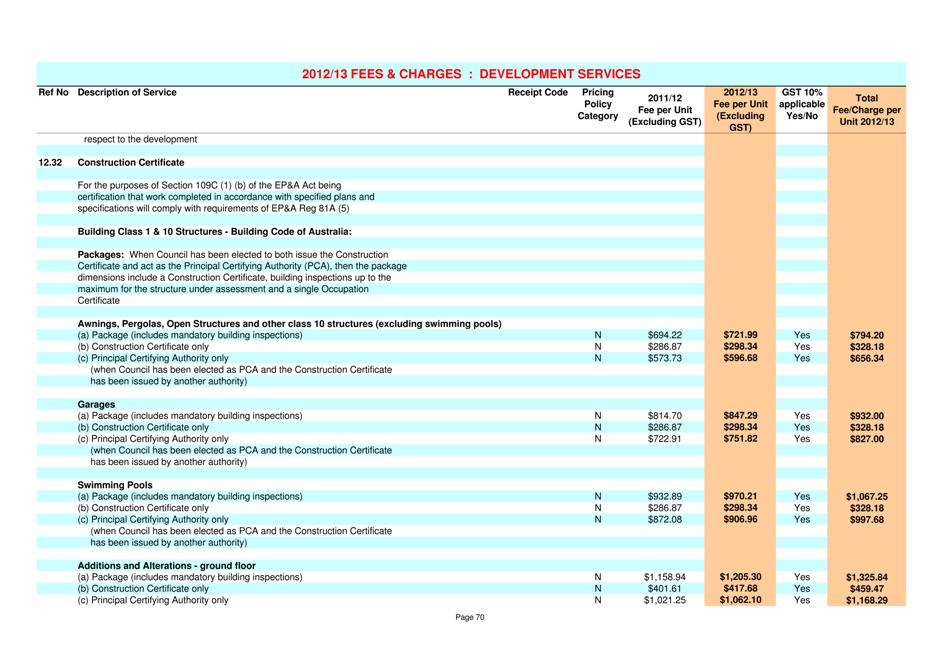
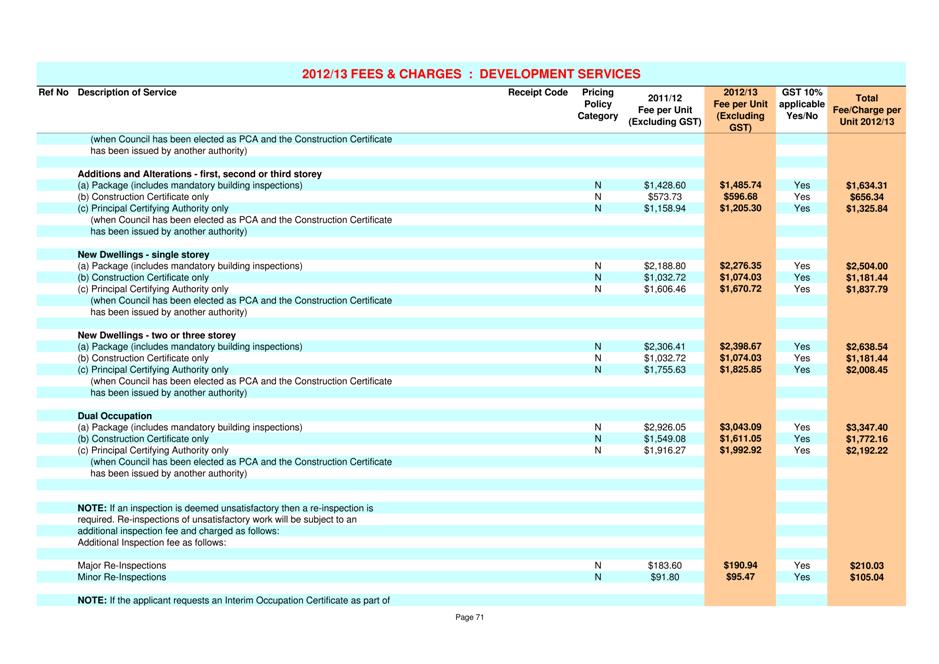
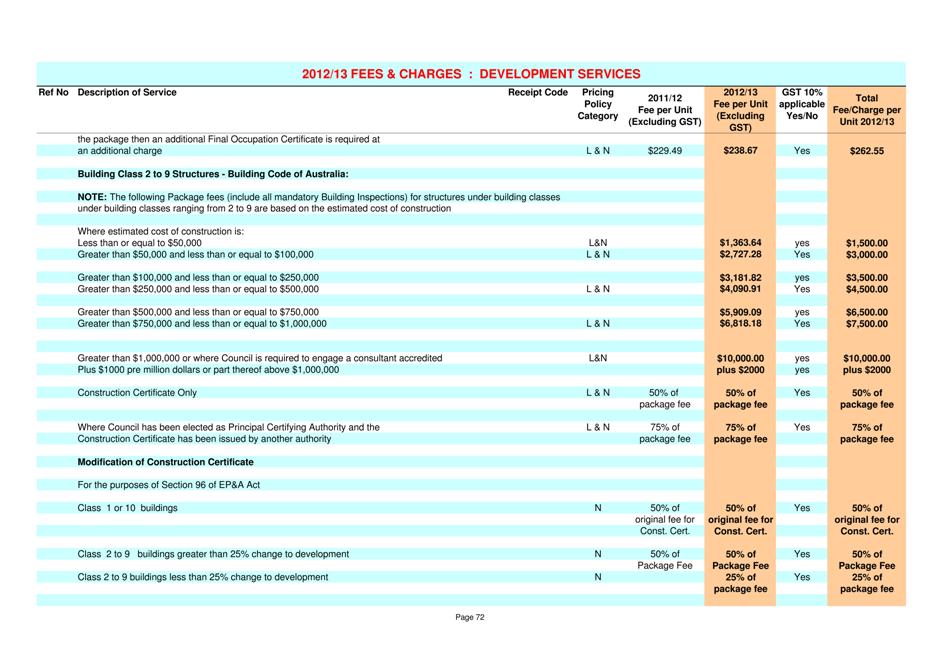
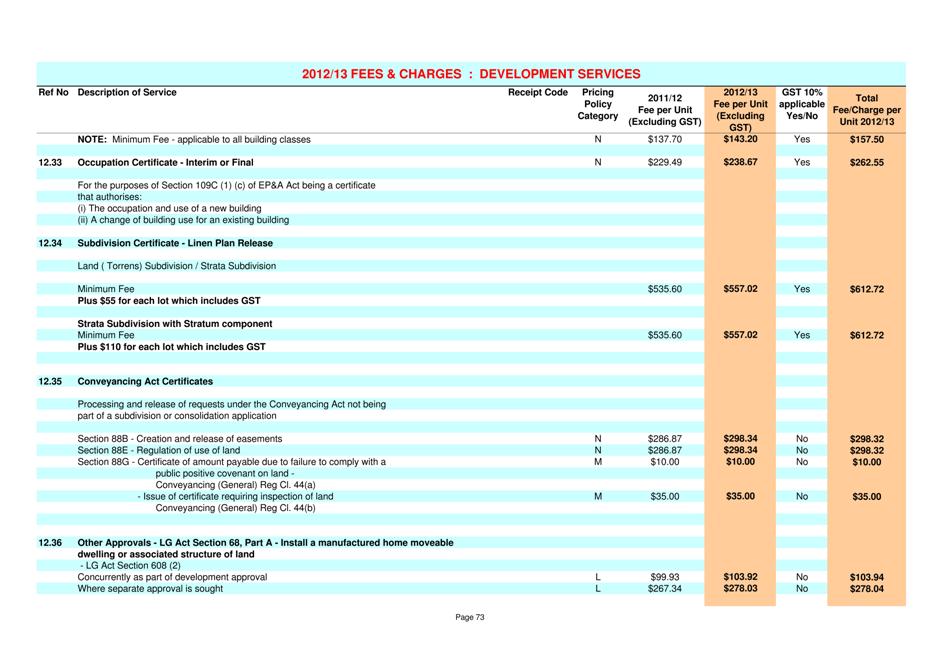
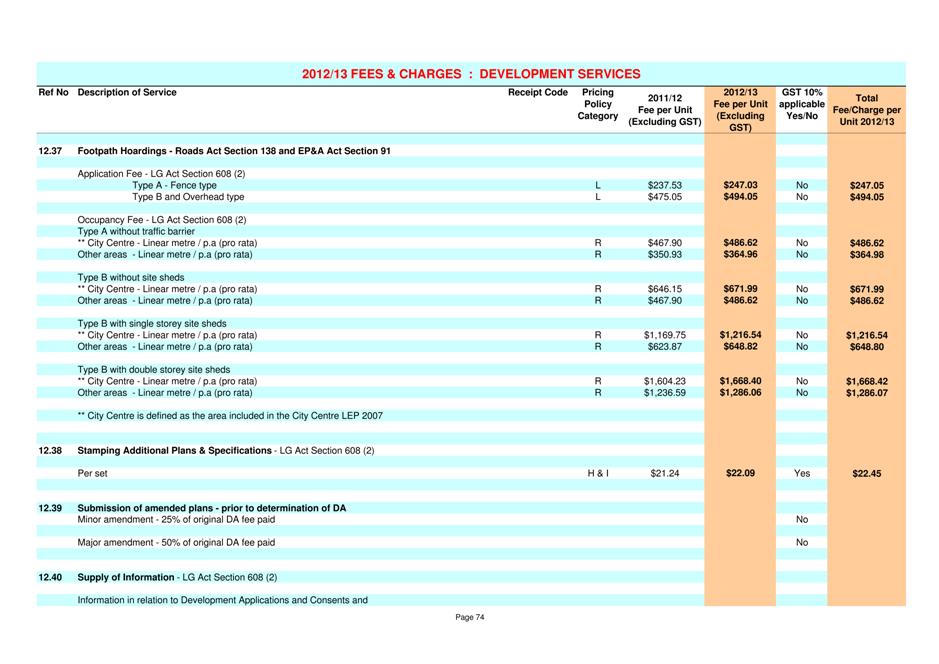
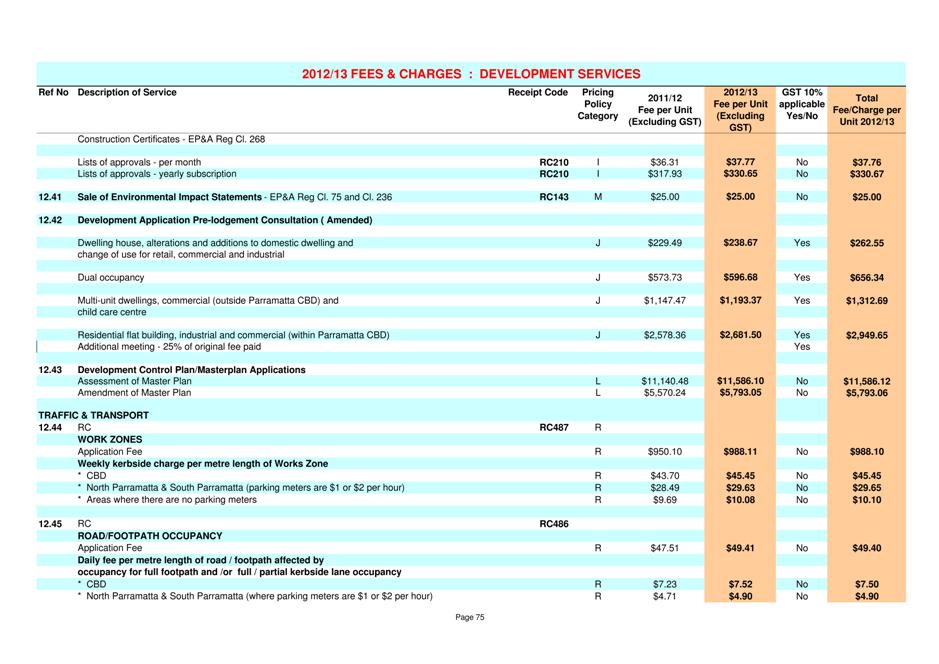
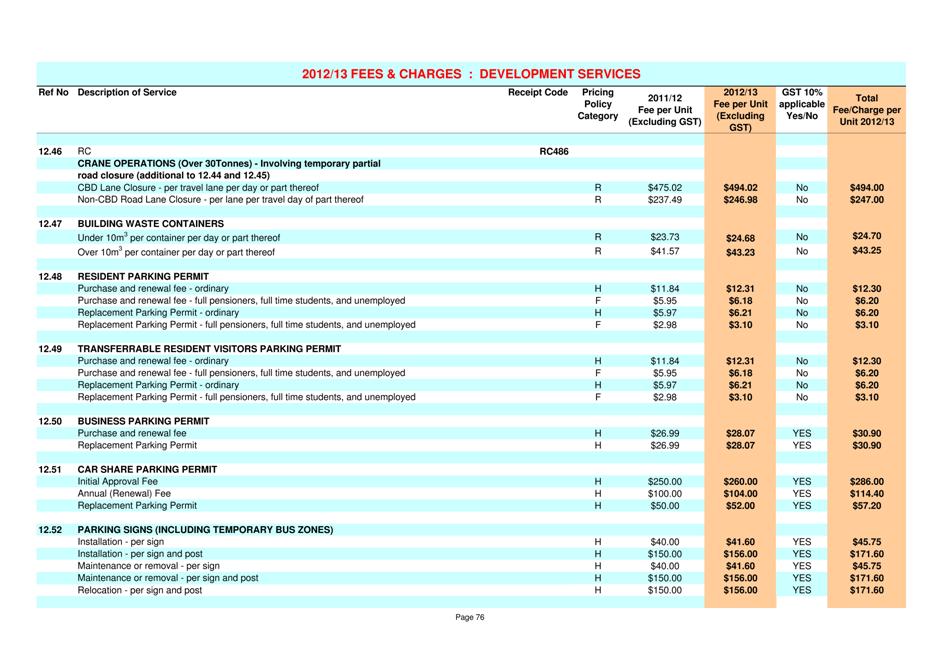
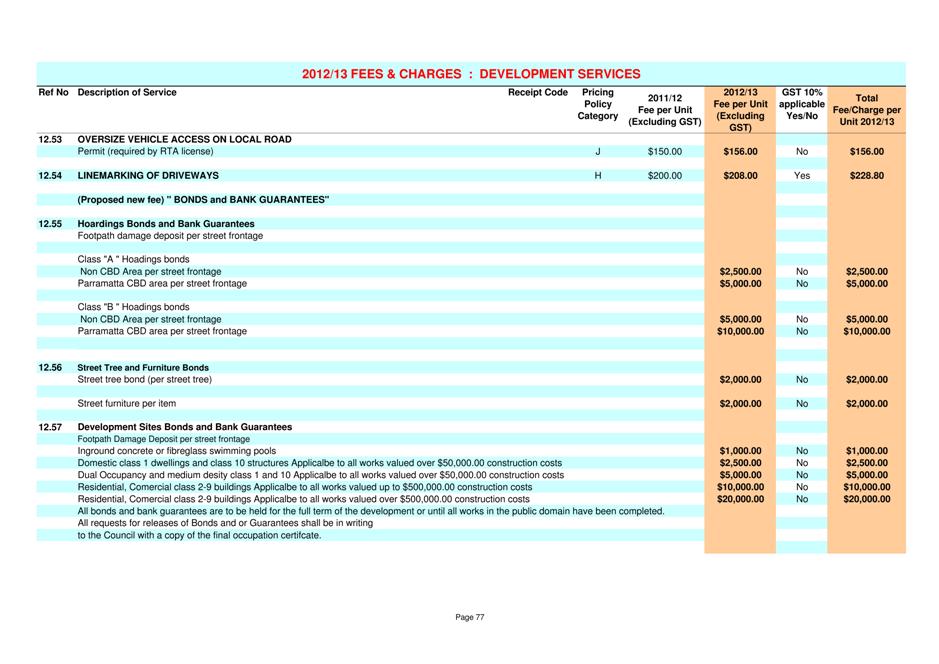
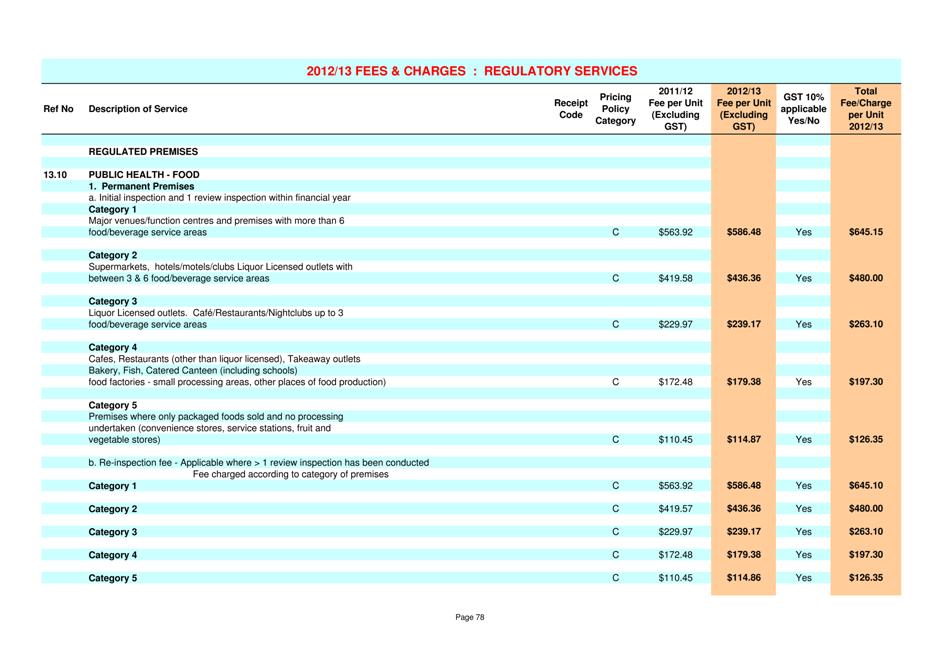
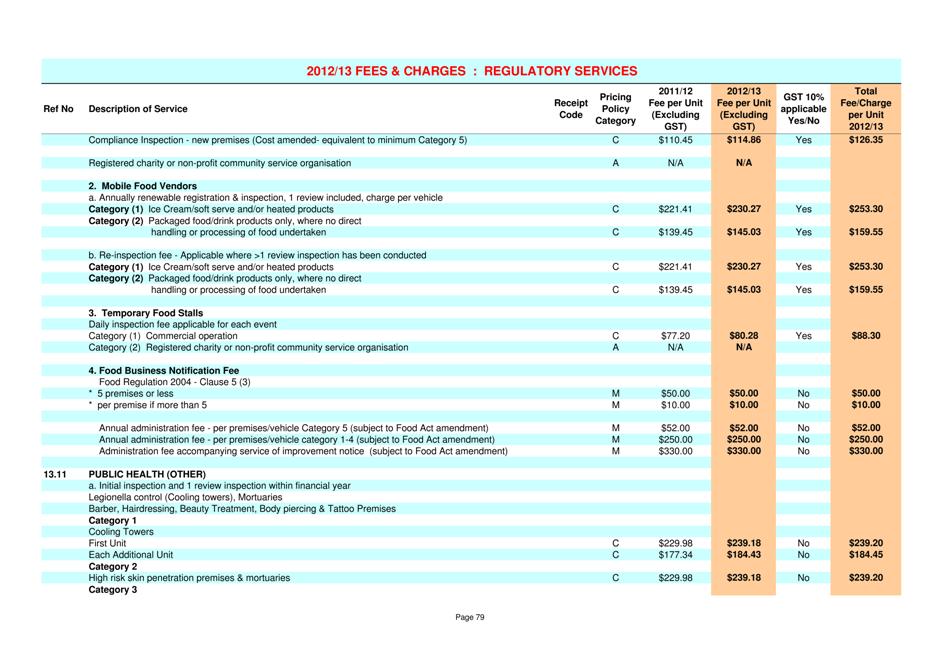
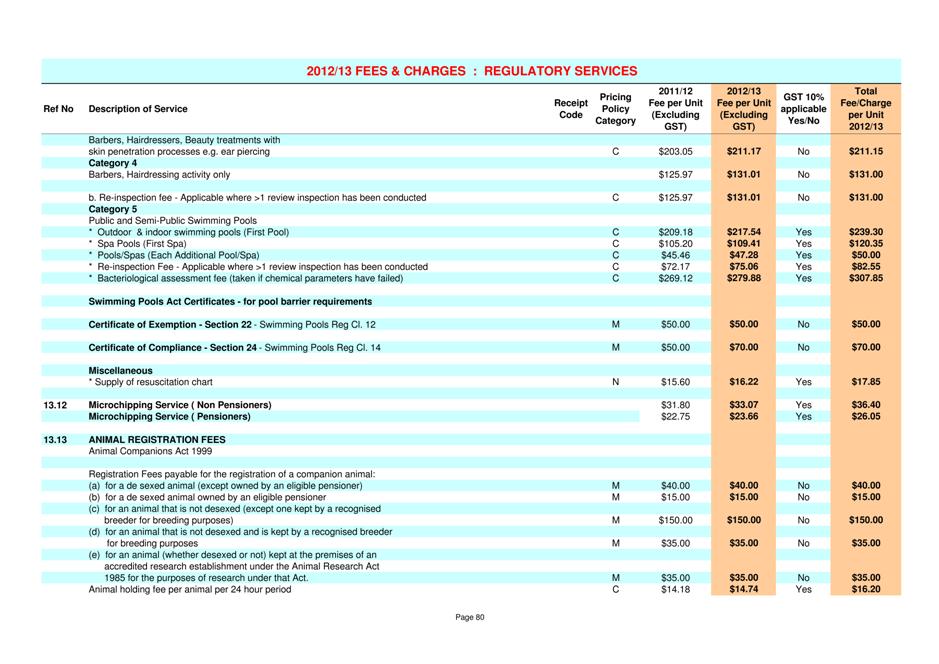
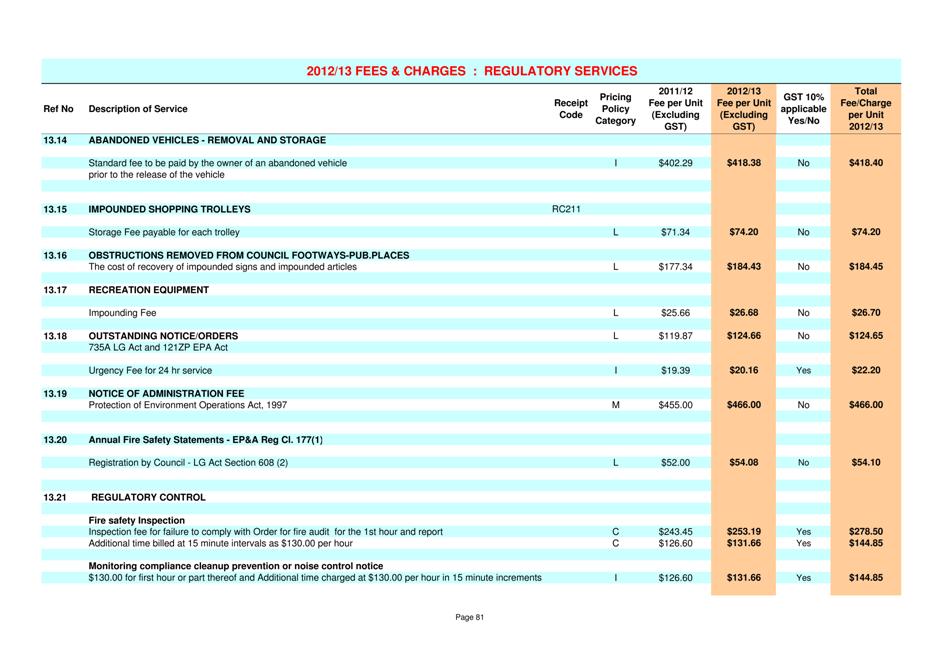
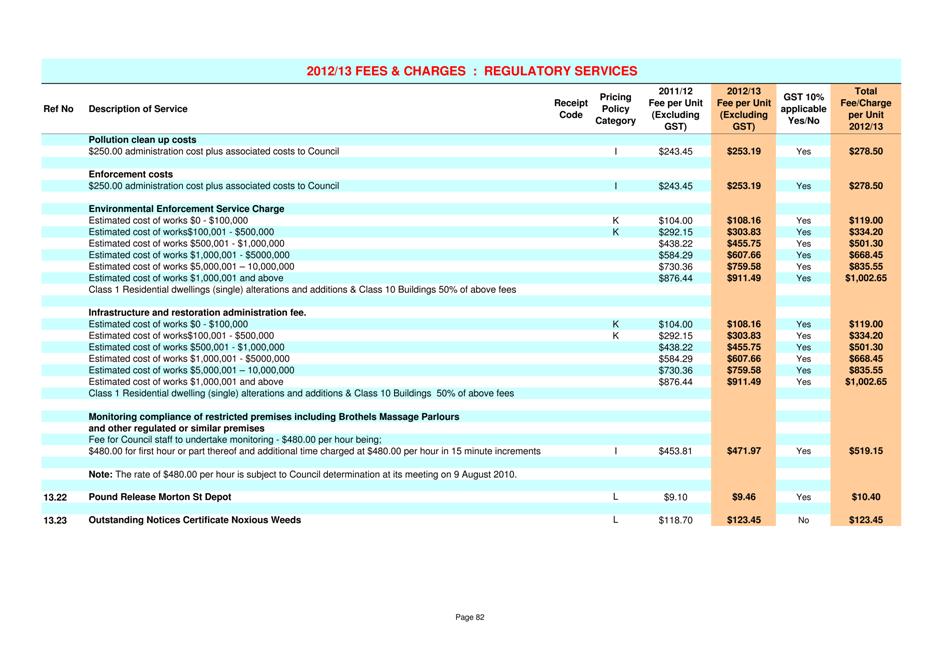
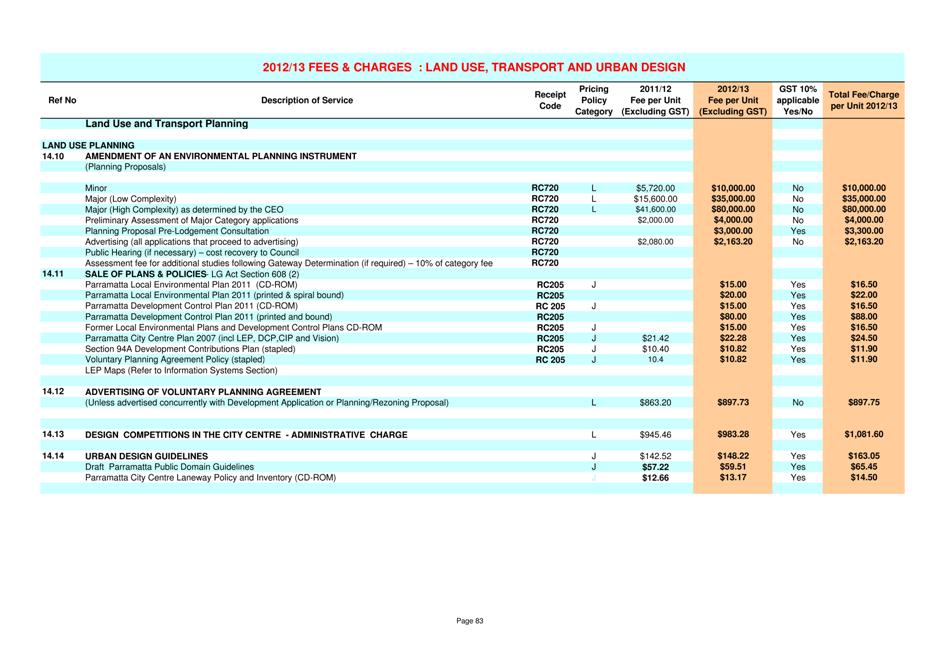
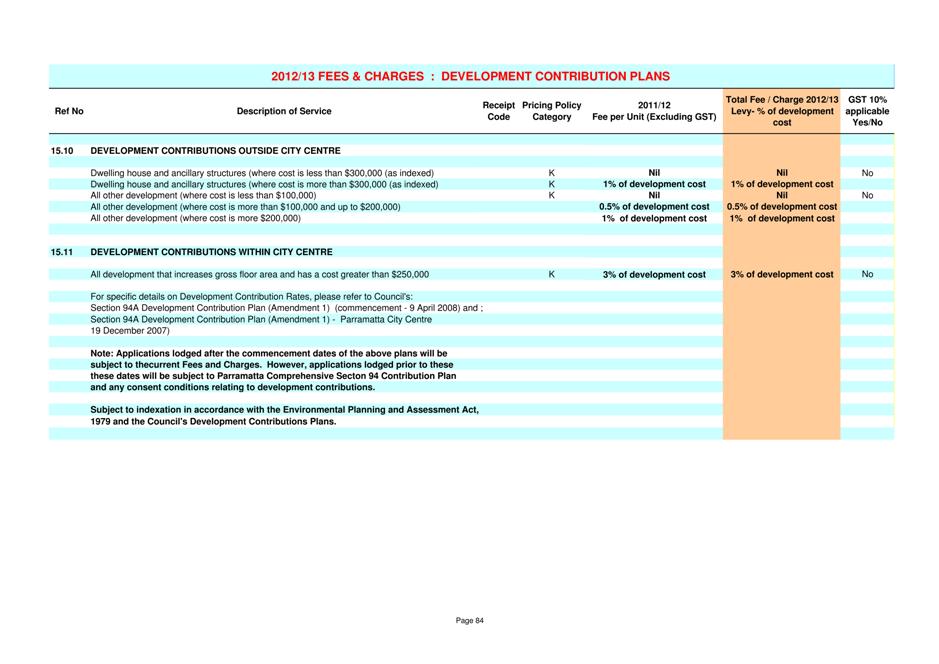
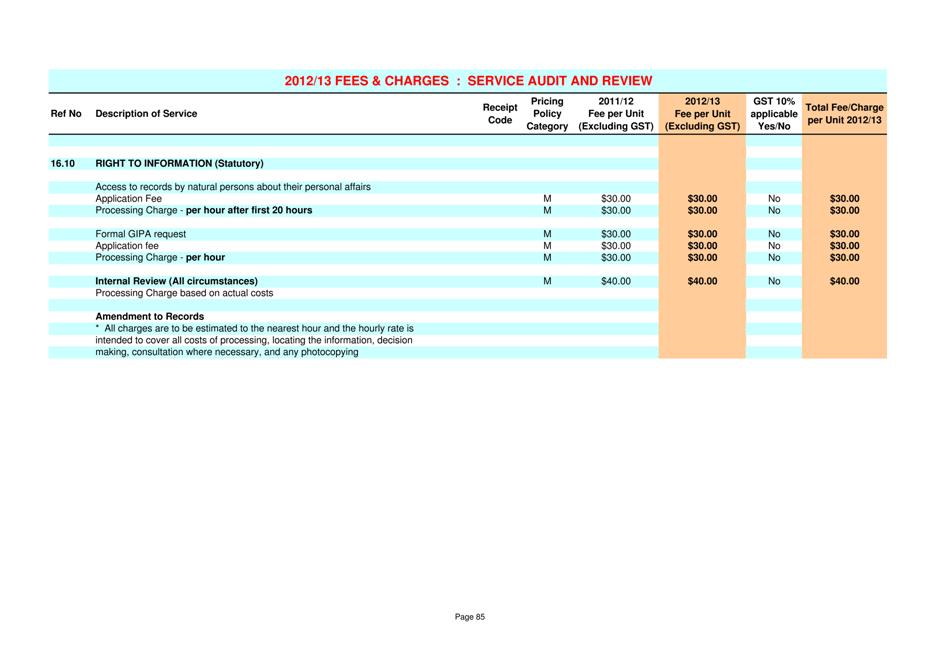
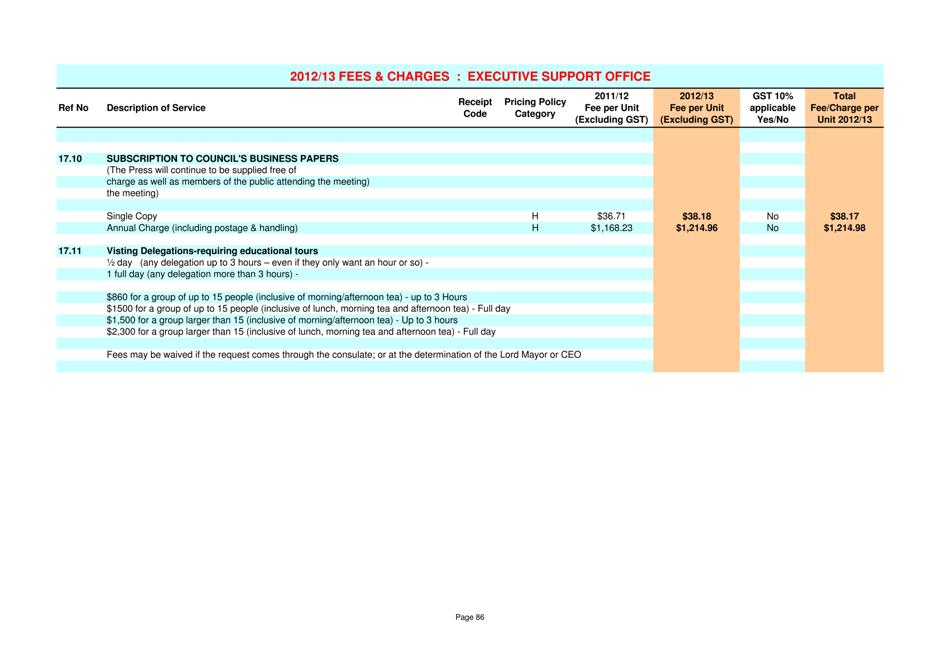
|
Item
11.3 - Attachment 3
|
Strategic Asset Management Plan (Updated March 2012)
(Distributed under separate cover to Councillors and Senior Staff. For a copy
pls contact council support on 98065314)
|
Parramatta
City Council
Strategic Asset Management Plan
March 2012
|
Item 11.3 - Attachment 3
|
Strategic Asset Management Plan (Updated March 2012)
(Distributed under separate cover to Councillors and Senior Staff. For a copy
pls contact council support on 98065314)
|
TABLE
OF CONTENTS
Executive summary.. 1
1. Introduction.. 2
1.1 Background. 2
1.2 Planning Relationships. 3
2. Policy.. 5
2.1 Background. 5
2.2 Relationship to Legislation. 6
2.3 Scope. 6
2.4 Purpose. 6
2.5 Asset Policy Statements. 7
2.6 Roles and Responsibilities. 7
2.7 Key elements of Asset Management 8
2.7.1 Stakeholders 8
2.7.2 Asset
Services 9
2.7.3 Finance 10
2.7.4 Asset
Systems and Decision Making Supports 10
2.8 Policy Guidelines. 12
3. Levels of Service.. 15
3.1 Service Levels Outcomes. 15
3.1.1 Reliability. 15
3.1.2 Quality. 15
3.1.3 Capacity. 15
3.1.4 Condition. 15
3.2 Consultation Process. 16
4. Future Demand.. 20
4.1 Demand Forecast 20
4.2 Population Forecasts. 21
4.3 Changes in Technology. 22
4.4 Demand Management Plan. 22
4.5 New Assets from Growth. 22
5. Risk Management.. 23
5.1 Risk Management Policy. 23
5.1.1 Scope. 23
5.1.2 Purpose. 23
5.1.3 Responsibilities. 24
5.1.4 Procedure. 24
5.2 Critical Assets. 24
6. Life Cycle
Management.. 31
6.1 Lifecycle Management Strategy. 31
6.2 Responsibility for Assets. 31
6.3 Work Categories. 31
6.3.1 Operations. 32
6.3.2 Maintenance. 32
6.3.3 Rehabilitation. 32
6.3.4 New
works. 33
6.4 Asset Data. 33
6.5 Asset hierarchy. 33
6.6 Asset Inspections. 35
6.7 Asset Revaluations. 35
6.8 Asset Valuations. 35
6.9 Asset Category – Infrastructure Assets. 36
6.9.1 Background. 36
6.9.2 Network
Analysis. 37
6.9.3 Key
Life Cycle Issues. 38
6.9.4 Asset
Capacity and Performance. 39
6.10 Asset Category - Buildings. 39
6.10.1 Background. 39
6.10.2 Network
Analysis. 40
6.10.3 Key
Life Cycle Issues. 40
6.10.4 Asset
Capacity and Performance. 40
6.11 Asset Category – Land. 40
6.11.1 Background. 40
6.11.2 Network
Analysis. 41
6.11.3 Key
Life Cycle Issues. 41
6.11.4 Asset
capacity. 41
6.12 Financial Forecasts. 41
6.12.1 Operations
and Maintenance Expenditure. 41
6.12.2 Renewal
Expenditure. 43
6.12.3 New
Asset Expenditure Forecasts. 45
6.12.4 The
Funding Gap. 47
6.13 Asset Management Practice and Improvements. 50
6.13.1 Asset
Management Gap Analysis. 50
6.13.2 Asset
Management Improvement Plan. 55
6.13.3 Monitoring
and Review Procedures. 58
TABLE OF FIGURES
Figure 1-1: Integrated Planning Framework
Figure 1-2: Resourcing Strategy Framework
Figure 2-1: Improvement Cycle
Figure 2-2: Asset Information and Financial Hierarchy
TABLES
Table 3-1 Strategic Objectives and Service
Level Outcomes
Table 4‑1 Demand Factors, Projections and Impact on Services
Table 6-1 Definition of road
condition
Table 6-2 Condition of existing
road network
Table 6-3 Operations and
Maintenance Forecast for Infrastructure and Land Assets
Table 6-4 Operations
and Maintenance Expenditure Trends for Building Assets
Table 6-5 Renewal Budgets for Infrastructure and Land Assets
Table 6-6 Major Repair/Renewal Expenditure for Building Assets
Table 6-7 Asset Expenditure for Renewals
Table 6-8 New Asset Expenditure Forecasts
Table 6‑9 Infrastructure
Service Level and Funding Analysis
APPENDIX A Asset Management Policy
APPENDIX B Draft Standard Operating Procedures for Enterprise Risk Management
APPENDIX C Draft Improvement Plan in Gantt Chart Format
The Strategic Asset
Management Plan (SAMP) was developed 2011 and has been reviewed and updated in
March 2012 to reflect changes in the recently updated Draft Delivery Program
2010/11 to 2013/14 and 2012/13 Operational plan.
|
Item 11.3 - Attachment 3
|
Strategic Asset Management Plan (Updated March 2012)
(Distributed under separate cover to Councillors and Senior Staff. For a copy
pls contact council support on 98065314)
|
Executive summary
This Strategic Asset Management Plan (SAMP) formalises
and documents the process of providing the framework to guide the financial and
physical requirements for the performance of Council’s Infrastructure, Building
and Land assets into the future.
In accordance with the Local Government Act 1993, and
under Parramatta City Council’s charter, the Council is required ‘to bear in
mind that it is the custodian and trustee of public assets and to effectively
account for and manage the assets for which it is responsible’. Further
the Council is ‘to have regard to the long term and cumulative effects of
its decisions’. This Strategic Asset Management Plan has been prepared in
order to give effect to Council’s responsibilities and to best manage these
assets for the community.
The objective of asset management is to enable assets
to be managed such that agreed Levels of Service are consistently delivered in
the most cost effective way. Levels of Service are established by Council
taking the communities expectations, legislative requirements and available
funding into account. While it has been acknowledged that Council does not
have any clear Levels of Service informed by community consultation, evidence
to date indicates that service provision has been at a level that has satisfied
the Parramatta community. Future customer Levels of Service are to be
determined at the next review of the Strategic Plan taking customer
expectations into account.
Growth forecasts indicate that additional
Infrastructure, Buildings and Land assets will be required in new growth areas
to accommodate additional demand for services. Acquiring new assets will commit
Council to additional funding to service the ongoing operation and maintenance
of the assets. These future costs are identified and considered in developing
financial forecasts.
Over recent years there have been insufficient funds
for road infrastructure renewal, this has resulted in a significant drop in
overall pavement condition. This combined with aging infrastructure and
increasing traffic volume will only accelerate pavement deterioration.
It needs to be understood that the road network is
ageing and unless Council is prepared to inject substantial funds, the road
network will face major deterioration over the next decade and beyond. In the
long term, delayed rehabilitation is more costly for very little benefit in
life extension. An assessment undertaken by Fugro PMS estimates that an annual
figure of $12.5 million is required to lift the road pavement condition to the
desired Level of Service in the next ten years.
Footpaths, drainage and bridges all have a backlog of
renewal works and require an annual expenditure to raise the condition of the
assets to the desired service level.
In preparing this asset management plan, it has been
identified that in recent year, renewals expenditure on building assets has
been insufficient, resulting in a significant backlog of required works. This
plan establishes that annual expenditure of $3.3 million and $3.2 million over
the next twenty years for maintenance and renewal works is required to recover
the existing backlog and sustain the desired service levels.
The current service level for the land assets is
assessed to be fair to good and the desired service level is good. In order to
raise the assets to the desired service level the required annual expenditure
is $2.5 million over the next ten years. This annual expenditure will also take
care of the current backlog of $1.6 million.
A gap analysis has been undertaken as part of this
asset management plan highlighting areas for improvement and best practice to
further develop Council’s asset management planning practices. An improvement
plan has been included in this document.
The SAMP would be reviewed and updated periodically
for any significant changes. Any updates since the plan was first developed in
2011 are shown in italics.
1. Introduction
The SAMP which was
developed last year is being reviewed and updated in March 2012 to reflect
changes brought about in the recently updated Draft Delivery Program 2010/11 to
2013/14 and 2012/13 Operational plan. Council has also recently put in an application for
the local infrastructure renewal scheme for addressing infrastructure renewal
backlog. Council’s
application for loan funding under the local infrastructure renewal scheme
(LIRS) which is subject to funding being made available aims to bring forward
previously planned additional capital expenditure of $6M/yr on asset renewal
in 2015/16 to 2012/13 (this is subject to the funding being made
available).
Some of the tables in the
plan have been updated to reflect the allocations under the draft devilry
program and consequently the Funding Gap for the various categories of assets.
1.1 Background
Parramatta City Council (PCC) is following the
guidelines that accompany the Local Government Amendment (Planning and
Reporting) Bill, 2009 in the development of this Strategic Asset Management
Plan. The Bill makes the development of a Strategic Asset Management Plan a
mandatory requirement for NSW Local Governments. The NSW legislation is
consistent with the national frameworks developed by the Local Government and
Planning Ministers’ Council. The national frameworks are:
· Framework 1: Criteria for Assessing Financial
Sustainability
· Framework 2: Asset Planning and Management
· Framework 3: Financial Planning and Reporting
The
primary role of assets is to support the delivery of services that deliver
Council’s long term objectives. As Council’s assets age there are increased
maintenance, refurbishment and disposal costs which increase the cost of the
services that they support. It is
currently estimated that Parramatta City Council has approximately $1.5 billion of depreciating physical assets.
The cost of asset creation or acquisition is generally
less than 20%[1] of the life cycle cost of an asset which includes
operation, refurbishment and disposal costs. Before any asset is purchased or
constructed the life cycle costs and risks must to be considered as they will
place an increased burden on Council’s budget. In an extreme position,
Councils can make themselves financially unsustainable in the longer term with
an aggressive asset creation program that does not consider the life cycle
costs.
The objective of this plan is to identify the balance
between service delivery requirements to maximise the achievement of Council’s
long term objectives and the life cycle costs of asset ownership within agreed
risk tolerances. The information currently available for each asset groups
dictates the level of sophistication of the strategy for that asset class.
As the Strategic Asset Management Plan moves to an
advanced[2] plan, demand analysis and a more detailed lifecycle
cost analysis will recommend assets that are to be acquired or disposed to
support service delivery within the confines of the budget.
Asset planning and management is supported by a
continuous improvement program that has limited resources within Council. This
document identifies work that needs to be undertaken to more effectively plan
and manage Council’s assets. In subsequent years the asset planning process
will become more embedded as a business process leading to planned asset
strategies that will be reflected in Council’s four year delivery program.
1.2 Planning Relationships
The
current Council planning framework has been revised to align with the
legislated planning framework in the Local Government Amendment (Planning and
Reporting) Bill 2009 and the Planning and Reporting Guidelines for Local
Government in NSW.[3] This plan has been developed in line with the
legislated framework.
The
legislated framework addresses the balance between the resources available
against the long term aspiration objectives of Council to ensure that there is
not an over commitment to resources (particularly assets) in the short term.
The
long term community plan for Parramatta City Council is outlined in Parramatta
Twenty25. This document provides a long term objectives (expressed in terms of
directions) for Council and the strategies to achieve those objectives. It
should be noted that Parramatta Twenty25 includes objectives in which Council
will perform an advocacy role of guiding the private sector and other entities
in delivering the objectives in the plan.
Ten
key strategic priorities have been developed and linked to a strategy in the
long term community plan. These priorities also guide the four-year delivery
program. As both the long term community plan and the four year delivery
program require community consultation, a strategy has been implemented to
ensure that the priorities align with community requirements.
Figure
1-1: Integrated Planning Framework
As
part of this planning process, Council has also prepared a Resourcing Strategy
which includes a Long Term Financial Plan, an Asset Management Policy and
Strategy and the Workforce Management Plan. Parramatta Twenty25, the Delivery
Program and Operational Plan have informed and been informed by the Resourcing
Strategy.
Figure
1-2: Resourcing Strategy Framework
This
Asset Management Policy and Strategy establish a framework to guide the
planning, construction, maintenance and operation of the infrastructure
necessary to achieve the objectives of Parramatta Twenty25 and the Delivery
Plan 2010-2014.
Underpinning
the Asset Management Policy and Strategy are individual Asset Management Plans
for the various classes of assets held by Council.
|
Item 11.3 - Attachment 3
|
Strategic Asset Management Plan (Updated March 2012)
(Distributed under separate cover to Councillors and Senior Staff. For a copy
pls contact council support on 98065314)
|
2. Policy
Council
adopted an Asset Management Policy on the 19th April 2010.
2.1 Background
Assets play a vital role in enabling services to
fulfil the environmental, social, cultural (including governance) and economic
outcomes for the community. Parramatta City Council is responsible for
ensuring that the billions of dollars of community assets under its ownership,
care and control are cost effective in achieving the long term community
objectives of the city.
Having sustainable assets requires Council to be
accountable in maintaining and wisely using existing assets to meet required
levels of service throughout the assets life.
Asset management requires the planning and acquisition
of assets to meet current and future service delivery demands. Informed
decisions are required about which assets are needed, where and in what numbers
and at what cost. Asset investment decisions are made with careful
consideration about the needs, costs and risks of maintaining and operating
assets over their useful lives, including the ultimate retirement of assets.
This approach recognises that the decisions made during any phase of an asset’s
life will affect performance and costs in another phase.
Best practice across Council’s asset portfolio will
result in:
· Assets that meet the requirements of the community at
minimal cost
· Knowledge about the impact that assets will have on
Council’s budget over the long term
· Informed asset investment decisions based on sound
knowledge of asset performance
· A program that minimises the risks of asset ownership
· Cost effective management and operation of existing
assets
Asset
management planning is a relatively new, yet ongoing business discipline that
will need to be embedded into Council’s planning, budgeting, operation and
reporting frameworks. Council will need to adopt a continuous business
improvement program to realise the substantial benefits that can be expected
from strategic asset planning.
2.2 Relationship to Legislation
Due to the significant risks to Council associated
with assets and the impact that assets can have in supporting the objectives of
Council, the NSW Department of Local Government is passing legislation[4] to mandate that a Strategic Asset Management Plan be
integrated into Councils planning and budget processes as one of the Resource
Plans.
The legislation is consistent with the national
financial sustainability framework. The legislation requires that a four year
Delivery Program be developed to move closer to the objectives and strategies
in the Long Term Community Plan. The Resourcing Strategy of assets, funds and
workforce need to inform and support the Long Term Community Plan and the four
year Delivery Program of the Council.
The
plan will include all assets owned by Council and any new asset solutions
proposed in the Long Term Community Plan and four years Delivery Program. The
asset acquisition, operation, maintenance, renewal and disposal schedules in
the Strategic Asset Management Plan will form an input to the Long Term
Financial Plan.
2.3 Scope
This policy applies to all physical assets and their
components with a useful life of more than one year.
Council has developed an asset hierarchy for the
management, planning and reporting of assets. The asset hierarchy can be found
in Section 6.2.
The
asset hierarchy may be modified as the requirements of the community change and
/ or the cost benefit of managing an asset a particular level deems it
necessary to change the hierarchy.
2.4 Purpose
This policy provides the overall framework to guide
the sustainable management of Council’s asset portfolio as a resource for service
delivery or as an investment portfolio for revenue. The policy will ensure
that:-
· Assets are effectively and efficiently managed through
the course of their life cycles
· There is a clear direction for informed decision
making
· Community needs and expectations are met
· Best value practices are incorporated into asset
management strategies and implementation activities
· Exposure to risk is managed through the application of
sound operational principles and practices
· Sustainable development is based on the recognition
that planning must include social, ecological, economic and cultural principles
· There is continual improvement in asset management and
service delivery
2.5 Asset Policy Statements
It
is a policy that:-
· Council will comply with all asset related legislation
and guidelines including the development of an annual Strategic Asset
Management Plan
· Council’s assets will be managed using a “life cycle”
approach in accordance with recognised best practice asset management
techniques
· Council’s assets will be utilised to their fullest
potential to maximise usage and economic performance
· Council will continually monitor, audit and review its
asset portfolio to ensure it is responsive to service delivery needs and meets
the objectives set by Council
· Council’s assets will be regularly maintained to
ensure that they continue to function as built for the duration of their life
· Council’s asset class management plans (included in
the Strategic Asset Management Plan) will guide the funding allocations for all
asset purchase, maintenance, rehabilitation and replacements
· Council will establish acceptable risk tolerances for
assets
· Prior to the approval of any significant asset
acquisition or renewal a detailed demand study, financial appraisal, risk
assessment and community consultation will be undertaken
· Returns will be maximised from Council’s asset
investment portfolio;
· The disposal of any asset shall be in accordance with
Council’s asset disposal policies and procedures
· Council will undertake regular community engagement to
determine satisfaction with the Levels of Service
2.6 Roles and Responsibilities
The roles and responsibilities for the management of
assets to be followed within Council are detailed in the Council’s Asset Roles
and Responsibilities document (TRIM Reference: D01063500). Key positions in
relation to Asset Management are:-
|
The Council:
|
Owns
all assets and acts as a steward for the assets.
The
Council will set the asset management policy and vision.
Ensures that resources are available for asset
management activities.
|
|
Executive Team:
|
Reviews
the Strategic Asset Management Plan (including the four year asset Delivery
Program) and asset business cases in line with this policy.
Advises Council on asset matters.
|
|
Strategic Asset Management Planning Board:
|
Strategic
Asset Management Planning Board (SAMP Board) has been established. The
objective of this Board is to acknowledge, endorse and review Best Value
Asset Management framework for Council and to take the concept back to their
teams and drive the processes within their Units.
Executive Team and the Council will review and
decide on major asset management strategies and programs.
|
|
Strategic Asset
Manager:
|
Is
delegated by Council to act in the capacity of asset owner and make
recommendations to Council.
Responsible
for the development of the Strategic Asset Management Plan which recommends
the most sustainable use of available funds across the asset portfolio.
Reviews all new asset acquisitions to ensure they are
consistent with Council’s long term objectives, that the life cycle costs
have been considered and that the asset can be funded within agreed risk
tolerances. The Strategic Asset Manager also manages the asset system.
|
|
Service Manager:
|
Uses
assets to provide a service to the community.
Provides the level of service requirements maximises
asset utilisation and reports on asset performance.
|
|
Asset Manager:
|
The
person in Council who is in the best position to manage an asset with the
required skills and experience.
The Asset Manager may be a service manager or the
service manager may allocate the management of an asset to an individual in a
specialist role (e.g. facility manager).
|
|
Asset Service Provider:
|
Is appointed by the Asset Manager to undertake work
in relation to an asset. Some examples include design engineers, surveyors,
maintenance officers, security officers.
|
|
Tenant
|
A person or entity that rents or occupies a
property.
|
|
Research and
Consultation Team (RCT)
|
Council
has a Research and Consultation Team (RCT), this team conducts surveys and
engages with the community on services needed and level of services provided.
RCT
mainly consult with the Residents' Panel, however they do consultation with
the larger community on service delivery such as with the Library, Childcare
Centres, Swimming Pools, Riverside Theatres, Parks, Halls, Infrastructure,
Heritage and Information Centres. CRT also uses the database of the users of
these particular services, for example CRT consults through surveys with people
who use and hire the halls, people who are on the library database.
On
average RCT does between 15 to 25 consultation and / or surveys per annum
|
|
Residential Panel
|
Resident
Panel is a group of over 2250 residents who volunteer to be involved in
community consultation processes. The Panel is a source of advice and is
important in shaping the future of the Parramatta Local Government Area.
|
2.7 Key Strategies (KS) for fundamental
elements of Asset Management
2.7.1 Stakeholders
2.7.1.1 Internal: Strategic Asset Management
Planning Board will ensure that all the internal stakeholders are involved.
2.7.1.2 External: External stakeholders are engaged
through Research and Consultation Team (RCT).
· KS1: In
consultation with the stakeholders develop, implement, review asset management
plans, policies and framework to ensure sustainable asset service delivery in
the most effective and efficient manner.
Goal: The
first cut of Strategic Asset Management Plan (SAMP) and Asset Management Plans
for Infrastructure, Building and Land are to be developed and adopted within
the next 3 months. These Plans will be reviewed as required.
· KS2: The
strategy for community and stakeholders is to implement a continuous
improvement cycle for delivering target asset services within the next 12
months. The goal is to develop, implement, monitor and review the
continuous improvement cycle.
Figure
2-1: Improvement Cycle
2.7.2 Asset Services
Strategies of Asset Services are:
· KS3: Implement
service level agreement with asset service providers
Goal: Develop, implement, monitor and improve
specific, measurable, achievable, relevant, timely service level agreement with
asset service providers within the next 6 months.
· KS4: Council
is given priority to maintain assets network to its existing size.
However as result of population growth and community
future demands some new assets will be required.
Goal: Develop business case framework dealing with
creating new assets to justify the need, option analysis, economical, social
and environmental impacts and ensure all financial impact of the asset over its
life cycle documented and Council could sustain the new services within the
next 3 months.
2.7.3 Finance
Strategies for Finance are:-
· KS5: Develop
strategies to close asset financial gap.
A number
of initiatives are currently being researched and explored some of these are:
• Target service delivery.
• Introduction of cyclic and plan preventative
maintenance plans.
• Dealing with ageing infrastructure - maintaining the
current assets network rather than enlarging it.
• Explore asset amalgamation/ reduction in asset network
• Asset Ownership: Asset hires vs. asset acquisition
e.g. for plant and equipment where/when it is economical.
• Introduction of user pay. Reduce the subsidy on non
essential assets.
· KS6: Develop
and implement asset financial system such that all activities in terms of
maintenance, capital works and disposal could easily be tracked against
individual assets.
This is
vital for asset performance measurement and reporting.
The definition and policy has been adopted. The new
financial/asset system has been set up with this requirement.
2.7.4 Asset Systems and
Decision Making Supports
Strategy for asset systems and decision making
supports is:
· KS7: Implement
a fully integrated total asset management system
Goals:
• Design, develop, implement a fully integrated asset
management system which can assist the Council with the asset life cycle
management, decision making and performance management within the next 3 years.
• Improve
the currency and accuracy of the asset data within the next 12 months.
Introducing
cyclic maintenance and replacement including cyclic inspection and using the
result to develop a priority plan, for preventative maintenance and asset
replacement program, will not only change work activities from being an
estimated 90% reactive to 90% proactive (planned work), but also optimises
asset life cycle, reduce the cost and the risks of asset failure.
PCC
Goals
KPI’s
Service
Activity
Asset Type
Asset Class
Asset Category
Asset Subcategory
|
|


Figure
2-2: Asset Information and Financial Hierarchy
By
having activity cost, operation cost and income against individual asset, it
will be possible to determine the economical benefit /or losses of particular
asset. The financial and economical impact of assets will help Council and the
community to make educated decisions on the level of asset services and whether
to keep and maintain replacement or create new or disposal of asset.
2.8 Policy Guidelines
Policy guidelines are
detailed in the Asset Management Policy that is located in
Appendix A.
|
Item 11.3 -
Attachment 3
|
Strategic Asset Management Plan (Updated March 2012)
(Distributed under separate cover to Councillors and Senior Staff. For a copy
pls contact council support on 98065314)
|
|
Objective
The objective of asset
management is to enable assets to be managed such that agreed Levels of
Service are consistently delivered in the most cost effective way. Levels of
Service are established by Council taking the communities expectations, legislative
requirements and available funding into account.
|
|
Elements of Asset Management
|
|
|
1- Stakeholder consultation
2- Asset Services
|
Key Strategies
|
Goal
|
Goal Priority
|
|
KS1
|
In consultation with the stakeholders develop,
implement, review asset management plans, policies and framework to ensure
sustainable asset service delivery in the most effective and efficient
manner.
|
The first cut of SAMP and
Asset Management Plans for Infrastructure, Building and Land are to be
developed and adopted within the next 3 months. These plans will be reviewed
as required.
|
G1
|
|
KS2
|
Develop clear Levels of Service informed by community
consultation.
The strategy for community and stakeholders is to
implement a continuous improvement cycle for delivering target asset
services
|
The goal is to develop,
implement, monitor and review the continuous improvement cycle for community
consultation within the next 12 months.
|
G3
|
|
2- Asset Services
|
|
|
KS3
|
Implement service level
agreement with asset service providers
|
Develop, implement, monitor
and improve specific, measurable, achievable, relevant, timely service level
agreement with asset service providers within the next 6 months.
|
G2
|
|
KS4
|
Give priority to maintain
assets network to its existing size
As result of population growth
and community future demands some new assets will be required, the strategy
is to:
1- Minimise new asset creation
2- Make sure any new asset created providing vital services to
the community and they are sustainable.
|
Develop business case framework dealing with creating new
assets to justify the need, option analysis, economical, social and
environmental impacts and ensure all financial impact of the asset over its
life cycle documented and Council could sustain the new services
|
G1
|
|
3- Finance
|
Key Strategies
|
Goal
|
Priority
|
|
KS5
|
Develop strategies to close
asset financial gap
|
A
number of initiatives are currently being researched and explored some of
these are:
•
Target service delivery.
• Introduction of cyclic and
plan preventative maintenance plans.
• Dealing
with ageing infrastructure - maintaining the current assets network rather
than enlarging it.
• Explore asset amalgamation/
reduction in asset network
• Asset Ownership: Asset hires
vs. purchase asset
• Introduction of user pay. Reduce the subsidy on non
essential assets
|
G1
|
|
KS6
|
Develop and implement asset
financial system such that all activities in terms of maintenance, capital
works and disposal could easily be tracked against individual assets
|
This is vital for asset
performance measurement and reporting.
The definition and policy has
been adopted. The new financial/asset system has been set up with this
requirement.
|
G1
|
|
4- Asset Systems and Decision Making Supports
|
|
|
KS7
|
Implement a fully
integrated total asset management system
|
• Design, develop,
implement a fully integrated asset management system which can assist the
Council with the asset life cycle management, decision making and performance
management within the next 3 years
• Improve the currency
and accuracy of the asset data within the next 12 months
|
G1
|
|
|
|
|
|
|
|
Item 11.3 - Attachment 3
|
Strategic Asset Management Plan (Updated March 2012)
(Distributed under separate cover to Councillors and Senior Staff. For a copy
pls contact council support on 98065314)
|
3. Levels of Service
3.1 Service Levels Outcomes
Each
of the asset management plans deals specifically with the service levels for
each asset category. These service levels have been combined to deliver four
asset related service level outcomes. The service level outcomes are:
· Reliability
· Quality
· Capacity
· Condition
Each
of the service level outcomes is related directly to Council’s Community
Strategic Plan – Parramatta Twenty25 (see Table 3-1). These service level
outcomes are essential to ensure the asset portfolio is not only maintained to
a satisfactory level but also caters for the future demands of the community
whilst balancing the potential risks to the community and the Council.
3.1.1 Reliability
To
ensure the asset base performs as required it is essential that the asset, no
matter what type of asset, it should be reliable and fit for purpose. As a
service outcome the Councils customers will require assets that are reliable
and can be relied upon to deliver the services that are not only expected, but
the services that are required.
3.1.2 Quality
In
addition to asset condition, quality is also very important. In this regard
Council should determine the quality of the assets required for the city area.
Quality will have more to do with manner and type of the asset rather than its
condition. An asset may be poor in quality yet have a condition which is
described as good.
3.1.3 Capacity
Council
will maintain assets that have capacity to meet the needs of the current and
future generations. Whilst this may be difficult in some cases, particularly
drainage assets, strategies should be implemented that will help minimise any
adverse effects of future demand.
3.1.4 Condition
In
order for Councils assets to assist in meeting the strategic goals and assist
in attaining the target asset condition it will be fundamental that assets are
in the appropriate condition. The determinate of appropriate condition in
various assets and asset categories will be dependent on the service levels
adopted by the Council.
3.2 Consultation Process
In August 2010 Council conducted a survey on the
Delivery Program (previously known as the Management Plan Survey) to understand
resident satisfaction with Council’s delivery of services and to assist with:
1. Forward
planning, including Council’s Delivery Plan (budgets and projects)
2. Service
planning, including Council Units/Services using resident satisfaction
indicators to measure service delivery and understand service requirements so
information could be used to develop and improve service plans through target
services delivery.
The 2010 survey was conducted in the field from 19th
June to 15th July 2010 and also conducted online and via post with
the Residents’ Panel. The survey was sent to all Resident Panel members and 734
completed responses were collected. This represents a confidence level of 95%
certainty +/- 3.6% (on a population of 150,000 residents). The sample is
considered representative of the general Parramatta community aged 19 and
above.
The Residents’ Panel is an advisory body to Parramatta
City Council. It help’s Councillors make decisions on Council investments and
services, that is based on ongoing feedback.
Parramatta City Council’s Resident Panel is a group of
over 2250 residents who volunteer to be involved in community consultation
processes. The Panel is a source of advice and is important in shaping the
future of the Parramatta Local Government Area.
No clear customer levels of service can be interpreted
from the above survey. An additional survey that is more clearly focussed on
customer satisfaction with assets is required to produce an indication of
customer levels of service.
|
Item 11.3 - Attachment 3
|
Strategic Asset Management Plan (Updated March 2012)
(Distributed under separate cover to Councillors and Senior Staff. For a copy
pls contact council support on 98065314)
|
Table 3-1 Strategic Objectives and Service Level
Outcomes
|
Parramatta City Council’s Strategic objectives
|
What does it mean?
|
How we will know we are reaching out strategic
objective
|
Key Performance Indicators include:
|
Service Level Outcome
|
|
Land and water that is protected, respected and
sustained
|
Parramatta’s natural
environment including the Parramatta River, its creeks and tributaries will be
protected and enhanced.
|
The health of our waterways is improving (includes
impact of development and stormwater).
Our land is fit for human occupation.
There is an increase in vegetation cover that
improves the land, stabilises the soil and cleanses the water.
The community values its natural heritage
|
Waterways condition (SIGNAL index)
Proportion of vegetation cover across the City.
Levels of water consumption.
% of known contaminated land that is remediated
|
Reliability (eg stormwater infrastructure meets the
needs of the City)
Quality (eg reducing stormwater pollutants from
entering waterways through the use of gross pollutant traps that protect the
natural environment)
Capacity (eg maintaining the natural structure of
waterways while managing water flows to ensure they do nor worsen floods or
erosion)
Condition ( eg enhancing bushland and vegetation
corridors)
|
|
A society that is healthy and compassionate
|
Parramatta’s residents
will be healthy, well educated and gainfully employed.
People who are in need or who are experiencing
difficulties will find the help they need.
|
There are sufficient services and support for people
in need of assistance.
The health of people in the community improves.
There are improved schooling and learning
opportunities
|
Wellbeing index
Job opportunities accessible for vulnerable people
Proportion of public health services v private
Trend in waiting lists for housing and other key
services
People with vocational or higher education
|
Quality (eg ensuring buildings and public areas are
accessible)
Capacity (eg appropriate community services and
facilities to meet residents needs)
Condition ( eg managing public health risks)
|
|
Businesses that are dynamic, prosperous and socially
responsible
|
Parramatta’s CBD and
local neighbourhoods will continue to grow and attract leading businesses.
They will be supported through education, training and research.
|
Businesses are stable and maintain a long term
presence in the City.
More businesses are contributing to community
services.
Increasing proportions of jobs for the resident
workforce
|
Commercial vacancy rates
Retail and commercial rental rates
Proportion of businesses contributing to community
services
Local jobs per resident workforce population
Distribution of income
Unemployment rates
Industry output
|
Capacity (eg supporting major commercial property
investment in the CBD - including Civic Place and developing infrastructure
to support the visitor/tourism sector)
|
|
Neighbourhoods that are liveable and distinctive
|
Neighbourhoods will be clean, green and safe – and
home to community-minded residents and successful businesses. New development
will be located close to shows, jobs and transport and residents will have
access to local sport and leisure facilities.
|
Residents are satisfied with the shops, open space
and leisure facilities in their neighbourhoods.
There is a decrease in the incidence of household
and personal crime and the perception of feeling safe is increased amongst
residents and visitors.
Residents feel comfortable where they live.
Neighbourhoods are clean and attractive
|
Resident level of satisfaction with neighbourhood
amenities
Urban housing intensification
Incidents of crime and perceptions of safety
|
Reliability (eg safety by design and graffiti
reduction)
Quality (eg regenerating town centres and provision
of community facilities including recreation facilities public toilets, bins,
seats, signs etc)
Capacity (eg ensuring infrastructure accommodates
current and future needs)
Condition ( eg developing and maintaining high
quality streetscapes)
|
|
A community that is diverse and cohesive
|
The people of Parramatta are proud of the
individual, community and cultural differences that make up this city and
celebrate its diversity
|
People value and enjoy the built and cultural
heritage.
People appreciate each other and the City’s cultural
diversity.
People living and working in Parramatta appreciate
and acknowledge the traditional land owners.
|
Perceptions of harmony
Contact with neighbours
Community involvement in public decision making
Rate of social and voluntary participation
|
Quality (eg meeting the diverse needs of the
community including range of community facilities)
Condition ( eg ensuring heritage assets continue to
be protected and conserved)
|
|
People and places that are linked by sustainable
transport and communication networks
|
Most people coming into Parramatta will use public
transport.
Residents will walk or cycle when moving around
neighbourhoods.
New technology will mean people communicate and work
in different ways.
|
People can access their workplaces easily.
Transport is available for all.
More people are using public transport than private
vehicles.
People have access to a variety of good quality and
reliable communication tools.
People can safely use a variety of transport modes.
|
Mode of travel to work
Frequency and reliability of public transport.
Reduction in car usage.
Reduction in community transport waiting lists.
% who rate ease of
travelling around the area as adequate or better.
% implementation of cycleways and footpaths
Phone and internet access
|
Reliability (eg implementing appropriate traffic
management measures)
Condition (eg creating pedestrian friendly
environment)
|
|
A city that is innovative and inspirational
|
Parramatta will be
renowned as a centre for the arts, technology and research – supporting and
encouraging local talent
|
Our community enjoys and participates highly in the
City’s arts and cultural activities.
Most people like the look and the feel of the City
Parramatta’s role in
research and innovation is visible
|
Satisfaction with the way the City looks and feels
Transition from education to work
Rating of the variety and quality of arts and
cultural events (adequate or better)
|
Quality (eg providing high level cultural
facilities such as Riverside Theatres)
|
|
Item 11.3 - Attachment 3
|
Strategic Asset Management Plan (Updated March 2012)
(Distributed under separate cover to Councillors and Senior Staff. For a copy
pls contact council support on 98065314)
|
4. Future Demand
4.1 Demand Forecast
Factors affecting demand include population change,
changes in demographics, seasonal factors, vehicle ownership, consumer
preferences and expectations, economic factors, agricultural practices,
environmental awareness and climate change.
The Parramatta local government area has been analysed
by suburb using Australian Bureau of Statistics data to determine the future
demands for services throughout the area. Parramatta Twenty25 estimated the
infrastructure requirements based on the population demand for services.
A number of trends that will impact on service
delivery are shown in Table 4-1.
Table 4‑1 Demand Factors, Projections and Impact on Services
|
Demand factor
|
Present position (2009)
|
Projection (2025)
|
Impact on services
|
|
Population
|
Estimated
Resident Population 167,431
|
Expected
Population 194,747
|
Population
growth will place an increased demand for the provision of Infrastructure
assets
|
|
Demographics
|
Mid-point
age range 30-34
%
Population older than 45 is 33%
|
Mid-point
age range 30-34
%
Population older than 45 is 34%
|
The
trend towards an aging population will place a higher demand on some
infrastructure assets
|
|
Transportation
Changes
|
Environmental
responsibility, rising fuel prices and increasing traffic all increase the
need for an integrated transport system with a reduced reliance on the use of
private motor vehicles
|
Transport
infrastructure will need to provide for increase use of public transport,
encourage the use of bicycles and include accessible footpath networks
|
The
design and provision of transport networks will need to address future needs
|
|
Increasing
Costs
|
The
costs associated with asset construction, maintenance and renewal is
increasing at a greater rate than Council’s revenues
|
Costs
increases are forecast to continue
|
The
need to carefully plan infrastructure is increasing in importance. A focus on
maximising the service that can be delivered within the funding limitations
is required.
|
|
Environment
and Climate Change
|
Current
position is known
|
Future
position is uncertain, but indications are that change is likely.
|
Some
infrastructure assets may be impacted by change such as more severe weather
events.
Additional
costs may be incurred to fund environmental initiatives
|
There is currently no
formal procedure to take this into account in determining demand forecasts for
the Council’s assets.
4.2 Population Forecasts
The Department of Planning as part of its Metropolitan
Strategy’s initiative provided indicative population forecasts for each local
government area in Sydney. Parramatta City Council commissioned an independent
consultant to look at the likelihood of Parramatta meeting the assigned target
and identify the suburbs in which growth is likely to occur. To ensure the
integrity of the empirical analysis suburbs with similar demographic
characteristics were grouped together.
• Carlingford, Dundas, Ermington and Rydalmere is expected to see a decline in the number of
residents of 2,261. A breakdown of the age structure indicates that this group
of suburbs have an aging population with little movement of people either in or
out of the area. The predicted decline may be reversed if there is
redevelopment which would attract new families into the area.
• Epping and Eastwood there has been a movement of young families into the suburbs replacing
retirees and older people over the last Census period of 2001 to 2006. At the
same time there had been a pronounced decline in the 20 to 29 year olds living
in the region. These trends are likely to continue into the future.
• South Granville, Granville, Guildford and Merrylands show a relatively high population growth of 17.9
percent to 2026. In the inter-census period of 2001 to 2006 there was a large
increase in the number of young children in these suburbs. This may be a
function of migration and/or high fertility rates. These suburbs have also
seen a fall in the 30 to 39 year olds living in the area. This suburb group
has also seen an increase in the West Asian and Middle East communities. It is
anticipated that these trends will continue for a couple of census periods
before growth slows down.
• The Parramatta, North Parramatta, Harris Park and
Rosehill group of suburbs encompasses
the Parramatta CBD. The Parramatta CBD has seen a large increase in multi
dwelling building in the years 2001 to 2006. This same period shows an
increase in the population of 56.2 percent to 6,683 residents. The majority of
this growth was in the 20 to 29 age group moving into the area. This trend of
20 to 29 year olds moving into city style living in the CBD has spilt over to
the surrounding suburbs. It is difficult to predict how long this group will
remain in the area. The continued forecasted high growth in population for
these suburbs is dependent on those moving into the area staying in the area
and starting families, together with the continued pattern of young people
coming into the area.
• Northmead, Wentworthville and Toongabbie is expected to have population growth in the 20 to 34
age group, particularly in the 25 to 29 age group. The proximity to Westmead
Hospital has some influence on younger people moving in to live close to work.
There has also been some spill-over affect from those wanting to live closer to
the Parramatta CBD. These suburbs are likely to see a continued loss in people
over 40 moving out.
• Winston Hills
has an aging population. This population group is less mobile than its younger
counterparts and hence the expected drop in residents by 2,445 or 23.6
percent. The fall in population is likely as a result of young people moving
out of established family households.
4.3 Changes in Technology
The main areas where technology changes may affect the
delivery of services are in the areas of construction materials and methods
which may potentially increase the life of some assets and reduce
susceptibility to damage.
Demand and usage changes may occur as a result of the
development of cost effective renewable energy transport options.
Changes in technology may also increase costs in some
areas. For instance, in the area of libraries, if the function of a library is
moving more towards providing access to electronic services, this will require
a change in the layout and fit-out for library.
4.4 Demand Management Plan
A formal Demand Management Plan does not currently
exist, however non asset based demand management solutions are continuously
being developed as part of the Councils ongoing performance improvement
strategies.
A Demand Management Plan needs to cover the management
of demand changes by:
· managing existing assets
· upgrading existing assets
· providing new assets to meet demands
· managing the demand for services provided by the
assets including consideration of non-asset solutions.
4.5 New Assets from Growth
The forecasts demonstrate that new infrastructure
assets will be required to meet future growth. Council will acquire these
assets from private land development activities and from its own construction
works.
Acquiring these new assets will commit council to fund
ongoing operation and maintenance for the assets for the period that the
service provided from the assets is required. These future costs are identified
and considered in developing financial forecasts.
|
Item 11.3 - Attachment 3
|
Strategic Asset Management Plan (Updated March 2012)
(Distributed under separate cover to Councillors and Senior Staff. For a copy
pls contact council support on 98065314)
|
5. Risk Management
5.1 Risk Management Policy
Parramatta City Councils Risk Management Policy
states:
Council will manage risks across all aspects of its
management and performance of functions and processes. Council will
systematically devise, implement and continually improve measures for the
management of risks in order to minimise or eliminate financial or other losses
to Council, arising from personal injury, financial loss, damage to assets, the
environment and the good reputation of Council.
Council has adopted AS/NZS ISO 31000:2009 Risk
Management Principles and Guidelines as the basis for its risk management
policy. It will collect information on risks from risk owners and record these
in a centralised database. All risks identified are to be assessed by the Enterprise Risk Management Committee (ERMC) and any changes or movements reported to
Executive Management.
Council is committed to making the necessary resources
available to assist those accountable and responsible for managing risk.
Council will ensure that risk management performance will be measured and
reported.
5.1.1 Scope
The Enterprise Risk Management policy applies to all
Councillors, Officers, Staff, Volunteers Contractors and Visitors to the extent
that their respective involvement with Council can contribute to or have some
influence on the risk associated with Councils business operations and
activities. The intention is to ensure the impact of any risk is dealt with to
ensure harm or loss is minimised and opportunities or potential is maximised.
5.1.2 Purpose
· Ensure Enterprise-Wide Risk Management is integrated
into Council’s strategic, operational and tactical planning processes so that
harm or loss can be minimised
· Achieve adequate, equitable and appropriate services
and facilities for the community at a reduced level of risk
· Have regard to the long-term and cumulative commitment
by Council to social, economic, environment and governance objectives review
and update these so as to clearly identify the application of risk management
· Deal with any potential conflicting interests through
the assessment of all risks by the Enterprise Risk Management Committee
· Through the integration of Enterprise–Wide Risk
Management Council seeks to demonstrate its accountability, dealing with risk
and integrity, maintaining an up to date and accurate database
5.1.3 Responsibilities
|
CEO
|
The
CEO is responsible for Council`s Enterprise-Wide Risk Management program.
|
|
Group Managers
|
Each
Group Manager has responsibility to ensure all risks associated with its
functions and processes are identified and managed effectively.
|
|
Managers, Service
Managers, Team Leaders, Supervisors, Staff, Volunteers, Contractors
|
Council
Officer, delegate, volunteer and contractor is responsible for actively
managing risks associated with the functions they perform.
|
|
Commercial and Risk
|
Facilitate
the collection of risk ids across Council and compile these into a central
register. Coordinate the review of risks by the ERMC and report
changes/findings monthly to Executive Team.
|
|
Enterprise Risk Management Committee (ERMC)
|
Assess risk ids as both uncontrolled and controlled
and record those assessments in a central register. Review policy and
associated guidelines and provide a point of contact/assistance for other
staff.
|
|
Control Owners
|
Each Control Owner has responsibility to ensure that
controls associated with their functions and processes are identified and
maintained effectively.
|
5.1.4 Procedure
The Standard Operating Procedures for Enterprise Risk
Management within Appendix B reflects the approach to be taken and
options available for the recording and assessment of risks. Please note that
this document is still in draft form.
5.2 Critical Assets
Council does not have a current method in place for
determining its critical assets, however from local knowledge and experience
the below assets have been identified as critical to the operation of Council
business.
|
Critical Asset
|
Why is asset critical?
|
How is the risk mitigated?
|
|
Infrastructure
|
Roads
|
Hassall Street
|
Roads
are classed as Regional roads and experience high volumes of traffic, have
high percentage of heavy vehicles and more severe accidents.
|
Regional Roads are
inspected six monthly by the RTA and a program of works is forwarded to
Council.
Council undertakes any
minor works generated from service requests.
There
are no response times documented however key performance indicators are being
produced as part of the COMBI review currently being undertaken by Council.
|
|
Parkes Street
|
|
O’connell Street
|
|
Rawson Road
|
|
Wellington Road
|
|
Loftus Street
|
|
Macquarie Street
|
|
Merrylands Road
|
|
Mombri Street
|
|
Pitt Street
|
|
Bold Street
|
|
Boundary Road
|
|
Clyde Street
|
|
Ferndell Street
|
|
Hector Street
|
|
Memorial Drive
|
|
Railway Parade
|
|
Mona Street
|
|
Railway Terrace
|
|
Randle Street
|
|
North Rocks Road
|
|
Fitzwilliam Road
|
|
Station Road
|
|
Oxford Street
|
|
The Portico
|
|
Albert Street
|
|
Pennant Street
|
|
Victoria
Road
|
|
Bettington
Road
|
|
Darcy
Road, Park Parade
|
|
Macarthur
Harris Street
|
|
Barney
Street
|
|
Wentworth
Avenue
|
|
Drainage
|
Lake Parramatta Dam
|
The
failure of the dam will cause major flooding downstream around North Parramatta and potentially loss of life.
|
Council has invested substantial capital to monitor the dam
in respect to any movement, seepage and rainfall data via a telemetry
system. The dam is also inspected on a 3 times a week frequency as per
the Dam Safety Committee requirement.
Emergency
plans have been put in place with Council’s LEMO Phil Littlewood when there
is any imminent danger of the dam failing.
|
|
Briens Road culvert
|
The culvert drains a large
catchment and is located beneath a Briens Road. The culvert is approximately
20 metres wide and 15 metres deep, and consists of four box culverts.
The
culvert has experienced partial blockages during storm events. A full
blockage could occur during a 1 in 50 or 1 in 100 year storm and would cause
flooding to private properties.
|
Briens Road culvert is inspected quarterly, and during and/or
following storm events.
|
|
McCoy Park Basin Toongabbie
|
The Basin is a flood mitigation structure to control
and reduce the impact of flooding to downstream properties.
|
This
structure is inspected on a monthly basis in accordance with Dam Safety
Committee Requirements. Capital has been invested in a monitoring system to
monitor water depths in the basin during flood events via a telemetry system.
Emergency Plans are also in place with Council’s LEMO Phil Littlewood when
there is any imminent danger of the basin failing.
|
|
Footpaths
|
Ada St
|
Footpaths in the CBD have a high volume of
pedestrians and pose a high risk to Council.
|
Footpaths in the CBD are
inspected on a daily basis as part of the daily cleaning undertaken.
There
are no response times documented however key performance indicators are being
produced as part of the COMBI review currently being undertaken by Council.
|
|
Aird St
|
|
Albion St
|
|
Anderson St
|
|
Argus Lane
|
|
Argyle St
|
|
Campbell St
|
|
Charles St
|
|
Church St
|
|
Cowper St
|
|
Darcy St
|
|
Fennell St
|
|
Fitzwilliam St
|
|
George St
|
|
Great Western Hwy
|
|
Grose St
|
|
Harold St
|
|
Harris St
|
|
Hassall St
|
|
Horwood Place
|
|
Hunter St
|
|
Kendall St
|
|
Lamont Parade
|
|
Little St
|
|
Macquarie St
|
|
Marion St
|
|
Marist Place
|
|
Market St
|
|
Marsden St
|
|
O'Connell St
|
|
Palmer St
|
|
Parkes St
|
|
Philip St
|
|
Pitt St
|
|
Ross St
|
|
Smith St
|
|
Sorrell St
|
|
Station St
|
|
Una St
|
|
Union St
|
|
Valentine
Ave
|
|
Victoria
Rd
|
|
Villiers
St
|
|
Wentworth
St
|
|
Wigram
St
|
|
Wilde
St
|
|
Bridges
|
Moxhams
Road bridge
|
Moxhams
Road bridge is a timber bridge that
has a tendency for termite attack.
|
Termite
inspection undertaken every six months. Timber components of bridge are replaced
about every ten years.
|
|
Land
|
Regional Parks
|
Campbell
Hill Pioneer Reserve
|
Parks and Reserves that are
used by a large number of residents and at a regular frequency.
|
No
action is taken by Council to mitigate the risk of critical land assets.
Playgrounds
are inspected for a annual audit by KICO and quarterly by Parks staff.
|
|
Lake Parramatta
Reserve
|
|
District Parks
|
Binalong Park
|
|
Boronia Park
|
|
Caber Park
|
|
Doyle
Ground
|
|
Dundas
Park/Curtis Oval
|
|
Granville Memorial Park
|
|
Granville Park
|
|
Prince
Alfred Park
|
|
Ray
Marshall Reserve
|
|
Upjohn Park
|
|
Robin
Thomas Park
|
|
Historic Cemeteries
& parks with Heritage significance
|
All
Saints Cemetery
|
|
Colquhoun Park
|
|
Elizabeth
Farm Reserve
|
|
Experimental
Farm Reserve
|
|
James
Ruse Reserve
|
|
K13
Submarine Memorial Park
|
|
Walter Lawry Methodist Memorial Park
|
|
St
Patrick’s Cemetery
|
|
Key natural areas/ bushland
reserves
|
Duck River
Reserve
|
|
Edna
Hunt Sanctuary
|
|
Galaringi
and Eric Mobbs Memorial Park
|
|
George Kendall Riverside Park
|
|
John
Curtin Reserve
|
|
Ponds/Subiaco
Creek Reserve
|
|
Reynolds Park
|
|
Third
Settlement Reserve
|
|
Toongabbie
Creek Reserve
|
|
Vineyard
Creek Reserve
|
|
Buildings
|
Administration Building
|
Buildings
that have high occupancy rates, are used by vulnerable groups and are used
during emergency operations are classed as critical.
|
No
inspections are undertaken on building assets, however there are required
response times for service requests on defects.
|
|
Depot
– Moreton St
|
|
Council
Chambers
|
|
Child
Care Buildings
|
|
Parramatta Town Hall
|
|
Granville Town Hall
|
|
Dundas Community Centre
|
|
Gilford
Community Centre
|
|
Telopea
Community Centre
|
|
Granville Swimming Pool Building
|
|
Item 11.3 - Attachment 3
|
Strategic Asset Management Plan (Updated March 2012)
(Distributed under separate cover to Councillors and Senior Staff. For a copy
pls contact council support on 98065314)
|
6. Life Cycle Management
6.1 Lifecycle Management Strategy
A lifecycle management strategy focuses on economic
and physical management options and strategies from initial planning through to
disposal stages of an asset.
Lifecycle Management aims to develop decision support
information, to model future asset maintenance and rehabilitation requirements
and compare these predictions with historical expenditure trends.
The
lifecycle management strategies for each asset category will outline:
· The objectives for the asset category
· Supporting data for each asset category
· Network analysis
· Key life-cycle management issues
· Asset capacity and performance
· Asset valuation
If the cost of all the asset strategies exceeds the
available budget Council will need to allocate funds to those assets that are
of the highest priority.
6.2 Responsibility for Assets
Asset managers have the asset management skills and
experience to plan and manage the assets over their useful lives. The asset
manager will liaise with service managers to determine their requirements for
the development of the asset strategy. The “Parramatta City Council Asset Roles
and Responsibilities” explains how these relationships work in practice.
The mapping links the service manager (person who uses
the asset) with the asset managers (people with the technical skills for the
asset’s management). Asset managers need to ask service managers what their
expectations are from the asset. If done correctly these expectations will
reflect the community’s requirements. These expectations are called levels of
service and are an advanced asset planning concept. The levels of service for
all of Council’s assets will be further developed in future asset plans.
6.3 Work Categories
The modelling of the lifecycle of assets requires the
input of data including asset economic life, estimates of remaining life,
average expenditures and asset replacement costs. The effective economic life
of any asset is linked to the maintenance carried out on that asset during its
life span.
Any estimate of asset economic life of an asset
assumes a certain level of maintenance in order to achieve that life but will
ensure the asset condition does not deteriorate ahead of its time. Maintenance
activities will not result in an increase in the economic life of an asset.
Rehabilitation activities are carried out so as to extend the economic life of
an asset. Therefore the asset net book value will increase as a result of
rehabilitation activity as the condition of the asset is restored to reflect
its original condition. Asset rehabilitation should be carried out at the
appropriate time as delays in some cases may cause rapid deterioration and as a
result, increase the cost for rehabilitation.
The
management activities to achieve the levels of service are identified in the
following work categories:
· Operations
· Maintenance
· Rehabilitation
· New works
6.3.1 Operations
Asset operation is necessary
to keep the asset appropriately utilised. Operational costs are running cost
to service the asset.
6.3.2 Maintenance
Routine maintenance includes the
day to day work required to keep assets operating at required service levels,
and falls into two broad categories:
· Planned (proactive) Maintenance: Proactive inspection
and maintenance works planned to prevent asset failure
· Unplanned (reactive) Maintenance: Reactive action to
correct asset malfunctions and failures on an as required basis (i.e. emergency
repairs)
Maintenance is defined in each
section of the lifecycle strategy, and includes:
· All repairs/maintenance which are not classified as
rehabilitation
A key element of advanced Asset
Management Planning is determining the most cost-effective mix of planned and
unplanned maintenance.
6.3.3 Rehabilitation
These works are defined as being:
· The rehabilitation of existing assets to their
original size and capacity, or,
· The replacement of the entire component of the asset
with the equivalent size or capacity, or,
· The replacement component of the asset works which
dose not increase the capacity of the assets.
6.3.4 New works
Projects (including land
purchase) for the extension or upgrading of assets required to cater for growth
or additional levels of service, including:
· Works which create an asset that did not exist in any
shape or form, or
· Works which improve an asset beyond its original size
or capacity, or
· Upgrade works which increase the capacity of an asset,
or
· Works designed to produce an improvement in the
standard and operation of the asset beyond its original capacity.
6.4 Asset Data
Council has recently started using an asset register
called TechnologyOne Works and Assets. Council is currently doing an analysis
of the capabilities of TechnologyOne to assess what other programs are required
to be integrated with TechnologyOne to fulfil all requirements. TechnologyOne
is not at present linked to a Geographic Information System (GIS), however this
will be required in the future.
Council has a strategy in place to improve the quality
of the data that is maintained within TechnologyOne.
This strategy includes assets in the following asset
categories:
· Infrastructure assets
· Building assets
· Land assets
6.5 Asset hierarchy
The asset hierarchy is a logical way of aggregating
assets for maintenance, operation, asset management, asset planning and asset
financial reporting. As long as there is one source of asset data at the lowest
level there can be a number of asset hierarchies. Council has been able to
create one hierarchy that supports all of the requirements listed in the first
sentence.
For example all the amenities in parks are aggregated
for asset planning purposes; the asset strategy is developed at that aggregated
level, yet the assets are maintained at the component level for each amenity
building and the amenities can be aggregated with other buildings for financial
reporting purposes.
The aggregation of the assets in the asset hierarchy
allows assets to be mapped to the services that they support. Some assets
support one service (e.g. library buildings support library services) whilst other
assets support a range of services (e.g. administration buildings support all
services occupying the building, IT equipment supports almost every service).
|
Asset Type
|
Asset Class
|
Asset
Category
|
|
Infrastructure
|
Roads, Bridges and Footpaths
|
Bridges
|
|
Footpaths
|
|
Cycle ways
|
|
Roads
|
|
Other Infrastructure
|
Street Furniture
|
|
Public Lighting
|
|
Parking Meters
|
|
Laneways
|
|
Other Infrastructure
|
|
Stormwater Infrastructure
|
Flood Control
|
|
Natural Water Courses
|
|
Drains
|
|
Park Infrastructure
|
Park Infrastructure
|
|
Buildings
|
Administration and Operation Buildings
|
Administration
Buildings
|
|
Operation Buildings
|
|
Civic Place Buildings
|
Council Chambers
|
|
Macquarie House
|
|
Administration Building
38 Darcy Street
|
|
Connection Arcade and Darcy Street Shops
|
|
Community, Library and Social Services Buildings
|
Child Care Buildings
|
|
Baby Health Centres
|
|
Buildings Leased for
Community Services
|
|
Libraries
|
|
Culture, Tourism and Recreation Buildings
|
Heritage and Visitor
Information Centre
|
|
Town Halls and Community
Halls
|
|
Park Buildings
|
|
Swimming Pools
|
|
Riverside Theatre
|
|
Property Investment Portfolio Buildings
|
Property Investment
Portfolio Buildings
|
|
Multi-Story Car Parks
|
Multi-Story Car Parks
|
|
Land
|
Community
|
Open Space (park)
|
|
Recreation Facility Land
|
|
Land Under
Administration and Operation Buildings
|
|
Civic Place Land
|
|
Property Investment Portfolio Land
|
|
Land Under Roads
|
6.6 Asset Inspections
Asset inspections are designed to identify defects
that have the potential to create a risk of damage or inconvenience to the
public and may impact on overall asset life. The asset inspections are to be
aligned with the hierarchy and recommend outcomes that may require maintenance
or changes to maintenance or operational processes.
6.7 Asset Revaluations
According to legislation AAS 27 released in 1996
Councils are required to revaluate their assets every five years. Council has
adopted to do revaluations every three years.
Revaluations of Infrastructure assets were first
undertaken in 2009/2010, and in 2007/2008 for Buildings and Land.
Some of the revaluation data is suspect due to the
methods used, for example the footpath assets were evaluated by using aerial
photographs and taking the year of development of the areas into account. Not
all footpaths were constructed at the same time as the roads and houses, and
therefore the valuation for footpaths is lists the condition as worse than it
actually is.
6.8 Asset Valuations
Parramatta City Council is responsible for management
of assets with replacement value of approximately $4.3 billion. This Strategic
Asset Management Plan just deals with infrastructure, land and building assets
as detailed below;
|
Asset Group
|
Replacement
Cost ($000’s)2009/10 values
|
|
Infrastructure
|
1,200,089
|
|
Roads
|
664,583
|
|
Footpaths
|
111,646
|
|
Bridges
|
89,237
|
|
Drainage
|
267,104
|
|
Kerbs
|
67,519
|
|
Buildings + Other
Structures
|
270,567
|
|
Libraries
|
9,211
|
|
Childcare Centres
|
6,453
|
|
Community Halls
|
9,583
|
|
Town Halls
|
9,602
|
|
Toilet Facilities
|
3,203
|
|
Baby Health Centres
|
1,011
|
|
Amenities Buildings
|
14,858
|
|
Administration Buildings
|
22,300
|
|
Club Houses
|
9,103
|
|
Commercial Buildings
|
34,802
|
|
Cultural Buildings
|
4,736
|
|
Theatres/Performing Arts Centres
|
31,083
|
|
Depot Buildings
|
3,969
|
|
Residential Buildings
|
1,988
|
|
Sporting Club Buildings
|
3,172
|
|
Swimming Pool Buildings
|
14,635
|
|
All Other Buildings
|
8,997
|
|
Other Structures
|
81,861
|
|
Land
|
2,755,993
|
|
Community Land
|
2,211,505
|
|
Operational Land
|
497,065
|
|
Investment Properties
|
8,379
|
|
Land Improvements
|
39,044
|
|
Total
|
4,226,649
|
6.9 Asset Category – Infrastructure Assets
6.9.1 Background
Council as the custodian of the Infrastructure assets
is responsible for ensuring the road, drainage, footpaths, parks, bridge and
cycleways networks will meet Council’s and the community needs by being safe,
accessible, economical and effective.
Council’s Infrastructure asset database details the
asset networks as follows:-
Road Pavement 519 km (30
km Regional roads and 489 km local roads)
Footpaths 600
km (approx.)
Cycleway
- green space 24 km
- on road or footpath 50 km
Laneways 20 km
Drainage pipes 438 km
6.9.2 Network Analysis
Council uses a Pavement Management System (PMS) to
assist in the planning, implementing and monitoring of the performance of the
road network. The PMS will rank roads with the priority for improvement works
based on factors such as budget allocation, roughness, traffic volumes and
visual inspection against preselected surface condition criteria. The PMS uses
Pavement Condition Index (PCI) to rate each road and calculate an average
rating for each road on a scale of 1 to 10, with 10 representing a newly
constructed road and 1 being a failed pavement at the end of its useful life.
To interpret this data, the following descriptors categorise the ratings for
the majority of roads within that descriptor:
Table 6‑1 Definition
of road condition
|
Assessment Grade
|
Asset Condition
|
Pavement Condition Index (PCI) for Road Network
|
|
1
|
As
new, requires normal maintenance only
|
8.5
to 10
|
|
2
|
Good
condition, requires minor maintenance
|
7 –
8.5
|
|
3
|
Acceptable
condition, requires significant maintenance
|
5.5
- 7
|
|
4
|
Poor
to fair condition, requires renewal
|
3.5
- 5.5
|
|
5
|
Very
poor to failed condition
|
<3.5
|
Overall,
the pavement condition index for the entire Parramatta local government area
road condition is currently ranked at 5 and is considered to be in a “poor-
fair” condition.
Table 6‑2 Condition
of existing road network
|
|
Network Average
2000
|
Network Average
2011
|
|
Number
of Street Sections
|
2308
|
2308
|
|
Section
Length (m)
|
220
|
220
|
|
Section
Width (m)
|
9.5
|
9.5
|
|
Design
Traffic (ESA)
|
7.68 x 10⁵
|
7.68 x 10⁵
|
|
Fatigue
Cracking (%)
|
5.2
|
12.7
|
|
Environmental
Crack (%)
|
3.2
|
17.7
|
|
Ravelling
(%)
|
7.1
|
34.8
|
|
Potholes
(%)
|
N/A
|
0.7
|
|
Irregular
Patching (%)
|
N/A
|
0.8
|
|
Heavy
Patching (%)
|
N/A
|
4.9
|
|
Subgrade
CBR (%)
|
N/A
|
6.9
|
|
Deflection
(mm)
|
N/A
|
1.06
|
|
Curvature (mm)
|
N/A
|
0.28
|
|
Roughness
(NRM)
|
N/A
|
114
|
|
Rut
Depth (mm)
|
N/A
|
2.7
|
|
Pavement
Condition Index
|
7.2
|
5.0
|
Condition
assessments of Council’s road assets were undertaken between December 2009 and
January 2010 by Fugro PMS. The current Pavement Condition Index (PCI) value for
Council’s road assets is 5 as shown above in Table 6-2. A PCI rating of 5
indicates that the road assets are in poor to fair condition.
Over
recent years there have been insufficient funds spent on road infrastructure
renewal. This has resulted in a significant drop in overall pavement
condition. This combined with aging infrastructure and increasing traffic
volume will only accelerate pavement deterioration.
It needs to be understood that the road network is
ageing and unless Council is prepared to inject substantial funds, the road
network will face major deterioration over the next decade and beyond. In the
long term, delayed rehabilitation is more costly for very little benefit in
life extension.
Footpath condition data was captured using aerial
photos and condition was estimated based on the age of the development not the
actual condition. In most areas, although the development is old the footpath
was not built until later. Generally the footpath network is in fair condition.
There are plans to capture footpath condition by visual inspection in the
financial year 2011/2012.
A condition assessment of Council’s drainage assets
was carried out by Bankstown City Council in March 2010. The results of the
assessment indicate that Council’s drainage assets are in fair to good
condition. The assets that were inspected as part of the assessment were pits,
lintels and covers. Conduit condition was also recorded by the surveyors at the
upstream pit locations. Due to the physical obstruction of the pit, it was only
possible to classify the conduit condition for up to approximately 30cm.
Council personnel have expressed their belief that the condition assessment of
the drainage assets in not reflective of the real condition of the assets. It
is believed that the drainage assets are in a worse condition than was
represented by the assessment.
6.9.3 Key Life Cycle
Issues
The key life cycle considerations
for this asset category are listed below:
· The rapid decay in assets as they reach the end of
their serviceable life
· Expected traffic growth on parts of the network will
be a direct result of population growth due to increased developments
· Future developments that increase the need for heavy
vehicles such as Buses and semi trailers, will have impact on road pavements
· Installation and rehabilitation of utility services is
impacting on asset condition. The quality of service authority reinstatements
needs to be reviewed and potential improvements to standards/ monitoring
implemented will be required
6.9.4 Asset Capacity and
Performance
The major factor in analysing road transport capacity
and performance is the expected increase in traffic and pedestrian loadings
within the network. The road transport network as a whole is in a fair-poor
condition and is meeting the capacity and performance requirements.
The footpath network as a whole is in fair condition
and is meeting the capacity and performance requirements. Council has a new
footpath program dealing with population growth and community demand.
Assessment of drainage lintels, covers and pits
indicate they are in fair to good condition. These assets appear to have
sufficient capacity and are performing adequately.
There is insufficient data on the remaining
infrastructure asset classes to establish their capacity and performance.
6.10 Asset Category - Buildings
6.10.1 Background
Building assets support the administration operations
of Council and provide support to the delivery of community and recreational
services of Council. Council’s Buildings
asset database details the following assets.
|
Category
|
No. of
Assets
|
|
Libraries
|
6
|
|
Childcare
Centres
|
6
|
|
Community Halls
|
2
|
|
Community
Centres
|
5
|
|
Town Halls
|
2
|
|
Toilet
Facilities
|
32
|
|
Baby Health
Centres
|
5
|
|
Amenities
Buildings
|
45
|
|
Administration
Buildings
|
2
|
|
Scout &
Guide Hall
|
5
|
|
Club Houses
|
13
|
|
Commercial
Buildings
|
5
|
|
Cultural &
Heritage Buildings
|
4
|
|
Theatres/Performing
Arts Centres
|
1
|
|
Depot Buildings
|
5
|
|
Residential
Buildings
|
10
|
|
Sporting Club
Buildings
|
16
|
|
2 Swimming Pool
Buildings- 5 Buildings
|
5
|
|
All Other
Buildings
|
67
|
|
Total
Buildings
|
236
|
|
Other
Structures (Multi Story Car-parks)
|
4
|
The
valuation data for Building assets is detailed in Section 6.6.
6.10.2 Network Analysis
A condition assessment of Council’s Building assets
was undertaken by Gutteridge Haskins and Davey Consultants (GHD) in 2007. The
results of the assessment show that on average the condition of the building
assets is fair. As large number of building assets were not assessed as part
of the inspections undertaken by GHD, their condition is unknown.
6.10.3 Key Life Cycle
Issues
The key life cycle considerations
for this asset category are listed below:
· The use of asbestos, particularly asbestos roof
materials in some of the buildings
· The high level of usage, as the population in the area
increases there will be increased pressure on these facilities
· The potential change in demographics and the impact
that will have on the services provided
· Clarification of the maintenance responsibility for
leased and tenanted properties should be carried out to ensure clarity for both
Council staff and the lessee
· Some facilities poorly located suffer from regular
attack by vandals. Whilst most of the damage is removed relatively quickly,
poorly located facilities will have a reduced service life
6.10.4 Asset Capacity and
Performance
In
regard to support of council personnel, the Building assets have adequate
capacity and are performing satisfactorily, excluding the Administration
building on Darcy St which is overcrowded and in a rundown state.
6.11 Asset Category – Land
6.11.1 Background
|
Asset Group
|
Quantity
|
|
Community Land
|
1305 ha
|
|
Parks and Reserves
|
733 ha
|
|
Formal Parks
|
160 ha
|
|
Bush Land
|
215 ha
|
|
Sporting grounds
|
197 ha
|
|
Operational Land
|
Not Available
|
|
Land Improvements
|
1077 (no. of)
|
The valuation data for
land assets is detailed in Section 6.4.
6.11.2 Network Analysis
The
land was re-valued by Scott Fullerton Valuations in 2007/08. The community land
and land improvement is due revaluation in 2011.
6.11.3 Key Life Cycle Issues
The key life cycle considerations
for this asset category are listed below;
· The high level of usage, as the population in the area
increases will increase pressure on these lands
· The potential change in demographics and the impact
that will have on the services provided
6.11.4 Asset capacity
During the making of the Parramatta Twenty25 document
it was deemed that there is sufficient capacity within the Council’s land
assets. This could change in the future dependent on census statistics,
demographics and changing house trends.
6.12 Financial Forecasts
6.12.1 Operations and Maintenance
Expenditure
Council was not able to extract past operations and
maintenance expenditure for their infrastructure and land assets. For the land
assets the forecast future expenditure is based on the current budget.
For the infrastructure assets a variety of methods
have been used to forecast the maintenance costs. For roads, drainage and
footpaths the forecast maintenance figures are based on a percentage of the
replacement cost of the asset groups. Roads and drainage is forecast to be 0.3%
of the replacement values, however footpaths is 2% due to age and condition.
The forecast maintenance costs for bridges are taken
from the report prepared by GW Engineers in 2008.
Table 6‑3 Operations
and Maintenance Forecast for Infrastructure and Land (Parks and Sport-fields)
Assets
|
|
2011/12
$000
|
|
Infrastructure
|
$6,066
|
|
Land
|
$9,868
|
There is past
expenditure information available for building assets as shown in Table 6-4.
Table 6‑4 Operations and Maintenance Expenditure Trends for
Building Assets
|
|
2007/8
$000
|
2008/9
$000
|
2009/10
$000
|
|
Buildings
|
1,951
|
1,990
|
2,029
|
For
building assets it is estimated that Council will need to set aside an average
of $3.3 million per year to cover ongoing consequential maintenance costs over
the next 20 years. This is based upon the Council’s specified Minimum
Acceptable Condition Levels (MACL). The expenditure forecasting was attained
from a report done by GHD Consultants in 2007, Report for the Condition
assessment and Estimated Reserves for Maintenance and Replacement of Buildings
and other Structures. The figures have been adjusted to allow for the
expenditure undertaken from 2007 to 2010 and the resultant additional backlog.
The
MACL is determined for each building asset dependent on its type and frequency
of use. For example, one building is used daily by the public and must be
maintained to high standards, the other is for storage purposes and can afford
to be kept to a lesser standard. However, safety is also taken into
consideration. Council and GHD jointly derived the MACLs while taking into
account Council’s asset strategies and ensuring that assets remain safe to use,
operate and maintain.
Council’s
Long Term Financial Plan has identified an expansion of $1 million in
maintenance expenditure from 2015/16. The following shows the existing gaps in
required maintenance expenditure and the anticipated impact of the additional
$1 million to be expended.
|
Asset
|
Current Service level
|
Funding allocated to maintain current
service level
|
Cost to maintain current level of
services
|
Gap
In
Millions
|
Gap after extra $1M allocation
|
|
Roads
Including
Kerb
|
PCI = 5 / Poor to Fair
|
$1.2M
|
$2.2M
|
-$1M
|
-$0.85M
|
|
Footpaths
|
87% ≥3 Poor
|
$1.4M
|
$2.3M
|
-$0.9M
|
-$0.82M
|
|
Drainage
|
35% ≥3 Fair to Poor
|
$0.3M
|
$0.82M
|
-$0.52M
|
-$0.3M
|
|
Bridge
|
17% ≥3 Fair to Poor
|
$0
|
$0.75M
|
-$0.75M
|
-$0.55M
|
|
Buildings and other
assets
|
Fair Condition = 3
|
$2M
|
$3.3M
|
-$1.3M
|
-$0.95M
|
|
TOTAL GAP
|
|
|
|
-$4.47M
|
-$3.47M
|
6.12.2 Renewal Expenditure
Renewal expenditure is work which does not increase
the asset’s design capacity but restores, rehabilitates, replaces or renews an
existing asset to its original capacity and condition. Work over and above
this is upgrade/expansion or new works expenditure. Major renewal works are
identified in Council’s work programs.
As with maintenance, there is no past expenditure
information for renewals of infrastructure assets. The current budget for
renewals expenditure is given in Table 6-5.
Table 6‑5 Renewal Budgets for Infrastructure
|
|
20011/12
$000
|
|
Infrastructure
|
$8,283
|
Major
renewal expenditure over the past three years for Building assets is shown in
Table 6-6.
Table 6‑6 Major Repair/Renewal Expenditure for Building Assets
|
|
2007/8
$000
|
2008/9
$000
|
2009/10
$000
|
|
Buildings
|
2,872
|
2,664
|
524
|
An
assessment was undertaken by Fugro PMS to forecast the required renewals
expenditure for road assets to achieve the desired service level. Similarly an
assessment was undertaken by GHD Consultants to forecast the required renewals
expenditure required for building assets.
For the remaining asset
groups, the renewals expenditure has been forecast from an analysis of the current expenditure,
condition, current service level and overall asset replacement value. Table
6-7 (a) shows the overall renewals expenditure required for Infrastructure,
Buildings and Land assets. Following Table 6-7 (b) reflects the allocations under the Draft Delivery
Program and 2012/13 Operational plan and shows the Funding Gap for the various
categories of assets for Financial Years 2012-15.
|
Item 11.3 - Attachment 3
|
Strategic Asset Management Plan (Updated March 2012)
(Distributed under separate cover to Councillors and Senior Staff. For a copy
pls contact council support on 98065314)
|
Table 6-7 (a) Asset Expenditure Required for
Renewals to achieve the Desired level
|
$000
|
2010/11
|
2011/12
|
2012/13
|
2013/14
|
2014/15
|
2015/16
|
2016/17
|
2017/18
|
2018/19
|
2019/20
|
|
Infrastructure
|
22,550
|
23,001
|
23,461
|
23,930
|
24,409
|
24,897
|
25,395
|
25,903
|
26,421
|
26,949
|
|
Buildings
|
3,200
|
3,264
|
3,329
|
3,396
|
3,464
|
3,533
|
3,604
|
3,676
|
3,749
|
3,824
|
|
Land
|
2,500
|
2,550
|
2,601
|
2,653
|
2,706
|
2,760
|
2,815
|
2,872
|
2,929
|
2,988
|
Table 6-7
(b) Capital expenditure summary by asset category and mix (renewal) $000
|
Category
|
Sub_Category
|
2012/13
|
2013/14
|
2014/15
|
2015/16
|
2016/17
|
2017/18
|
2018/19
|
2019/20
|
2020/21
|
2021/22
|
|
Renewals Infrastructure
and Buildings
|
INFRASTRUCTURE
|
|
|
|
|
|
|
|
|
|
|
|
|
Roads & Kerb and
Gutter
|
6,817
|
6,916
|
6,768
|
9,291
|
9,569
|
9,856
|
10,152
|
10,457
|
10,770
|
11,093
|
|
|
Drainage
|
520
|
530
|
540
|
741
|
763
|
786
|
810
|
834
|
859
|
885
|
|
|
Bridges
|
130
|
137
|
145
|
199
|
205
|
211
|
217
|
224
|
231
|
238
|
|
|
LAND IMPROVEMENTS
|
1,985
|
1,947
|
1,418
|
1,947
|
2,005
|
2,065
|
2,127
|
2,191
|
2,257
|
2,325
|
|
|
BUILDINGS AND RELATED
ASSETS
|
2,277
|
1,487
|
1,477
|
2,027
|
2,088
|
2,150
|
2,215
|
2,281
|
2,350
|
2,420
|
|
Renewals Infrastructure
and Buildings Total
|
11,729
|
11,016
|
10,348
|
14,205
|
14,630
|
15,069
|
15,522
|
15,988
|
16,467
|
16,961
|
|
Renewals - Other
|
Library books
|
750
|
750
|
800
|
1,098
|
1,131
|
1,165
|
1,200
|
1,236
|
1,273
|
1,311
|
|
|
Other
|
19,799
|
11,007
|
321
|
440
|
453
|
467
|
481
|
495
|
510
|
525
|
|
|
Plant and Equipment
|
4,333
|
4,479
|
4,632
|
6,358
|
6,549
|
6,745
|
6,948
|
7,156
|
7,371
|
7,592
|
|
Renewals - Other Total
|
|
24,882
|
16,237
|
5,753
|
7,896
|
8,133
|
8,377
|
8,629
|
8,887
|
9,154
|
9,429
|
NB: Renewals
Other / Other includes the New Operations centre $19.52M in 2012/13, 10.76M in
2013/14 and 60K in 2013/14. Although this relates to replacing existing
Council depots, it has not been included in the renewals as it a one off and
would distort the analysis
6.12.3 New Asset
Expenditure Forecasts
New assets may be created to meet growth, social or
environmental needs. Assets may also be acquired by Council from land
development activities. Council has identified capital expenditure for new
assets over the next ten years as shown in Table 6-8.
Table 6‑8 New Asset Expenditure Forecasts (by asset
category)$000
|
Category
|
Sub-Category
|
2012/13
|
2013/14
|
2014/15
|
2015/16
|
2016/17
|
2017/18
|
2018/19
|
2019/20
|
2020/21
|
2021/22
|
|
New
|
INFRASTRUCTURE
|
|
|
|
|
|
|
|
|
|
|
|
|
Roads & Kerb and
Gutter
|
5,759
|
4,461
|
4,533
|
11,790
|
9,866
|
9,492
|
9,150
|
8,943
|
9,225
|
6,701
|
|
|
Footpaths
|
1,200
|
1,250
|
1,350
|
3,512
|
2,939
|
2,827
|
2,725
|
2,664
|
2,748
|
1,996
|
|
|
Drainage
|
990
|
1,398
|
820
|
2,133
|
1,785
|
1,717
|
1,655
|
1,618
|
1,669
|
1,212
|
|
|
LAND IMPROVEMENTS
|
1,280
|
1,655
|
890
|
2,315
|
1,937
|
1,864
|
1,797
|
1,756
|
1,811
|
1,316
|
|
|
BUILDINGS AND RELATED
ASSETS
|
970
|
750
|
650
|
1,691
|
1,415
|
1,361
|
1,312
|
1,282
|
1,323
|
961
|
|
|
OTHER
|
|
|
|
|
|
|
|
|
|
|
|
|
Other
|
4,190
|
2,180
|
1,633
|
4,249
|
3,555
|
3,421
|
3,297
|
3,223
|
3,324
|
2,415
|
|
|
Plant and Equipment
|
3,615
|
180
|
150
|
390
|
327
|
314
|
303
|
296
|
305
|
222
|
|
New Total
|
|
18,004
|
11,874
|
10,026
|
26,080
|
21,824
|
20,996
|
20,239
|
19,782
|
20,405
|
14,823
|
Civic
Place is a major new capital project.
Council is committed to this essential urban renewal project as it is a vital
element in the development of Parramatta as the second major Sydney CBD. In February 2012, there has been a significant change
to the Civic Place project arrangements, with the contract negotiated in July
2006 with Grocon being ended following mutual agreement. At the time of
updating this plan, Council was yet to consider alternative options in relation
to the Civic Place project.
Council has plans to develop a new Operations Centre
which will replace its current Works Depot and centralise some other Council
functions from their existing locations. The new development will be funded
from the sale of existing properties but short term borrowing of $10M million
will be required to allow the project to proceed. The expenditure and funding
estimates for this project are included in the plan as a renewal/replacement of
existing assets.
Other new capital expenditure will have to be provided
to meet the infrastructure needs flowing from the anticipated growth in
resident and worker populations and positioning Parramatta as Sydney’s second
CBD. Funding for these projects will be sourced primarily from development
contributions, capital grants, and the
prudent allocation of discretionary reserve funds. The CBD and suburban infrastructure special rates are
also essential contributors to delivering improvements in the Parramatta CBD
and key neighbourhood areas in the LGA as part of Council’s aim to position Parramatta as Sydney’s second CBD.
The table below shows the
total expenditure on capital projects included in Council’s Updated Delivery
Program broken up by funding source
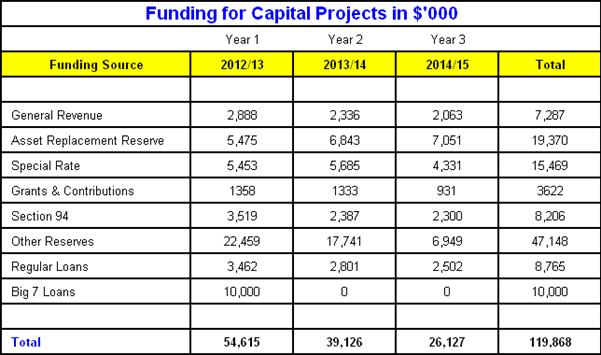
6.12.4 The Funding Gap
From the various analyses undertaken for Council’s
infrastructure, building and land assets the current backlog of work and
funding gaps in asset replacement are shown in Table 6-9 below.
Table 6‑9 Infrastructure
Service Level and Funding Analysis based on funding allocation for Financial
Year 2010/11
|
DESCRIPTION
|
Current Service level
|
Cost to maintain Current Service Level
(Million)
|
Current Funding
(Million)
|
Gap to maintain current Service Level
(Million)
|
Desired Service Level
|
Cost to maintain Desired Service Level
(Million)
|
Gap to deliver Desired Service Level
(Million)
|
Expenditure required to move to Desired
Service Level
(Million)
|
Replacement cost
(Million)
|
|
INFRASTRUCTURE
|
|
$1,204
|
|
|
|
|
Roads
Including
Kerb and gutter
|
PCI = 5
|
$8.8
|
$7.4
|
-$1.4
|
PCI=6.4
|
$13.3
|
-$5.9
|
$115.7
|
$732
|
|
Footpaths
|
87% ≥3 Poor
|
$1.3
|
$0.0
|
-$1.3
|
52% ≥ 3 Fair to Poor
|
$4.1
|
-$4.1
|
$22.3
|
$112
|
|
Drainage
|
35% ≥3 Fair to Poor
|
$2.7
|
$1.1
|
-$1.6
|
15% ≥3 Fair
|
$4.8
|
-$3.7
|
$53.4
|
$270
|
|
Bridges
|
17% ≥3 Fair to Poor
|
$0.25
|
$0.01
|
-$0.24
|
15% ≥3 Fair
|
$0.35
|
-$0.34
|
$2
|
$90
|
|
|
|
LAND IMPROVEMENTS
|
Fair to Good = 2.5
|
$1.7
|
$1.7
|
0
|
Good = 2
|
$2.5
|
-$0.8
|
$1.6
|
$39
|
|
|
|
BUILDINGS AND RELATED ASSETS
|
Fair = 3
|
$2.8
|
$0.8
|
-$2.0
|
Fair to Good = 2.5
|
$3.2
|
-$2.4
|
$9.3
|
$271
|
|
Total Physical Assets
|
|
$17.6
|
$11.1
|
-$6.5
|
|
$28.3
|
-$17.2
|
$204.3
|
$1,514
|
|
|
|
|
|
|
|
|
|
|
|
|
|
NB: Above figures do not include library books, plant
and equipment and vehicle assets
Council’s LTFP provides for an expansion of renewals
expenditure from 2015/16 to address the current funding gap revealed in the
above table. This expansion would be directed towards the asset categories in
the proportions indicated in the above analysis.
Renewal
Capital expenditure allocation and the funding gap for Financial Years 2012-15 based on Draft Delivery Program and 2012/13 Operational plan ($000)
|
Asset Classification
|
Current Service level
|
Annual Cost to
Maintain Current service Levels
|
Current Funding
Allocated
FY 2012/13
|
Funding
Gap FY 2012/13
|
Current Funding
Allocated FY 2013/14
|
Funding
Gap FY 2013/14
|
Current Funding
Allocated FY 2014/15
|
Funding
Gap FY 2014/15
|
|
INFRASTRUCTURE
|
|
Roads Including Kerb
& Gutter
|
PCI = 5
|
$8,800
|
$6,817
|
$1,983
|
$6,916
|
$1,884
|
$6,768
|
$2,032
|
|
Footpaths
|
87% ≥3 Poor
|
$1,300
|
$0
|
$1,300
|
$0
|
$1,300
|
$0
|
$1,300
|
|
Drainage
|
35% ≥3 Fair to Poor
|
$2,700
|
$520
|
$2,180
|
$530
|
$2,170
|
$540
|
$2,160
|
|
Bridges
|
17% ≥3 Fair to Poor
|
$250
|
$130
|
$120
|
$137
|
$114
|
$145
|
$105
|
|
LAND IMPROVEMENTS
|
Fair to Good = 2.5
|
$1,700
|
$1,985
|
$0
|
$1,946
|
$0
|
$1,418
|
$282
|
|
BUILDINGS AND RELATED
ASSETS
|
Fair = 3
|
$2,800
|
$2,277
|
$523
|
$1,487
|
$1,313
|
$1,477
|
$1,323
|
|
Grand Total
|
|
$17,550
|
$11,729
|
$6,106
|
$11,016
|
$6,781
|
$10,348
|
$7,202
|
NB: Above figures do not include library books, plant
and equipment and vehicle assets
|
Item 11.3 - Attachment 3
|
Strategic Asset Management Plan (Updated March 2012)
(Distributed under separate cover to Councillors and Senior Staff. For a copy
pls contact council support on 98065314)
|
6.13 Asset Management Practice and Improvements
6.13.1 Asset Management
Gap Analysis
The gap analysis process has been carried out
generally in accordance with the International Infrastructure Management Manual
2006 Edition.
The study process included the following steps:-
· collection and review of relevant Council asset/asset
management information
· meetings with and/or discussions with relevant Council
staff
· identification of asset management categories and
components/activities
· identification of best practice asset management
practice elements/criteria for each component/activity
· assessment of current asset management practice
against the various best practice asset management criteria and elements
(generally assessment made considering frequency, emphasis, formality, systems
and results)
· assessment of desired asset management practice to be
achieved within the target timeframe against the various best practice asset
management criteria and elements (generally assessment made considering
frequency, emphasis, formality, systems and results)
· identification of the gap between current asset
management practice and desired asset management practice
An asset management gap analysis covering all asset
classes was undertaken in December 2010, the results of the gap analysis are
shown in the Tables below. The desired score for each component is 8. The
findings of the gap analysis form the basis of the improvement plan.
6.13.2
Asset Management Improvement Plan
An initial draft detailed improvement plan in Gantt
chart format is included in Appendix C. This improvement plan must be
re-assessed to take into consideration the level of internal resource available
to undertake the tasks as the existing resource capacity is unlikely to be able
to delivery on the indicated resource requirements. The Improvement Plan Gantt
Chart should become a working document for Council to use to monitor and update
the progress of the achievement of the Improvement Plan tasks.
Asset Knowledge / Data
· Document asset hierarchy for all assets so that assets
can be easily identified
· Review the current asset location and attribute data
for all assets and collect missing data with target 98% coverage and 95%
confidence with data across all asset classes
· Determine activity types so that costs can be
allocated against individual assets across all asset classes, costs need to be
identified as operational, maintenance and capital expenditure. Future capital
expenditure should be identified as renewal, expansion or new asset expenditure
· Develop a common asset condition monitoring system
consistent across all asset classes, based on a 1 – 5 rating
· Develop a program of ongoing asset condition
monitoring for all assets, based on values of the assets and on the rate of
decay of the asset
· Review existing asset condition assessment for roads
and ensure compatible with the condition rating system
· Record asset condition data into an asset management
system on an ongoing basis
· Develop a written corporate procedure for obtaining
and monitoring utilisation and performance data for each asset class
· Collect and record utilisation data on a regular basis
· Collect and record performance data for all assets
against defined service/ performance criteria
· Develop a written procedure for data capture for GIS
· Develop a written corporate procedure for identifying
and recording lifecycle costs for all asset types
· Ensure lifecycle cost data is accurately recorded and
captured in the corporate asset management system
· Develop written corporate procedure for the valuation
and depreciation of all assets classes to be based on fair value and ensure
that valuation data is inputted into the corporate asset management system
Data
processes / techniques
· Ensure that an identification systems is documented for
all assets
· Develop written corporate procedure for asset data
capture including collection frequency and processes for data collection
· Develop a corporate procedure for condition rating,
including guidelines on how assets are condition rated in each asset class
· Carry out condition rating assessments in all asset
classes as per the agreed inspection regime
· Identify and document performance and utilisation
measures for each asset class, taking Levels of Service into account
· Document the procedure for linking assets in the GIS
to the Asset Management System
· Develop a written corporate procedure for the handover
to Council of developer, RTA and Council originated assets
· Document and detail responsibilities for asset data
management in all asset classes. Develop a written corporate policy for data
management practices to ensure the integrity and security of all asset data
· Develop and introduce data validation and auditing
procedures
Strategic
Asset Planning Processes
· Develop written corporate procedure on establishing,
reviewing and updating Levels of Service and Asset Performance. The Levels of
Service shall initially be based on existing service provision
· Develop target performance levels in each asset class
to ensure levels of Service will be achieved
· Ensure that all levels of service and performance
targets are measurable and that monitoring systems are documented and in place
for all asset classes
· Develop written asset condition strategy, taking
Levels of Service into account
· Document procedure for community/ customer research
and consultation on Levels of Service and performance targets
· Develop written corporate growth and demand forecast
strategy, including process for incorporation into forward planning
· Develop and implement risk analysis/ assessment
procedures for asset management, asset operations/ maintenance management and
capital works planning/ evaluation
· Develop and implement written corporate procedures for
Optimised Decision Making for all asset classes
· Undertake lifecycle planning for all major assets and
develop robust long term financial forecasts
· Develop written corporate policy and procedure on
financial forecasting, taking operations and maintenance, Levels of Service,
demand forecasts and depreciation into account
· Develop robust long term forecasts for all assets
including funding/ revenue forecasts
· Review and develop and document existing capital works
prioritisation procedure
· Identified prioritise capital works included in
financial forecasts and asset management plans
· First Cut Asset Management plans to be prepared for
all major asset classes
Operations Maintenance and Work Processes
· Existing operations and maintenance strategies to be
documented, and strategies prepared where not in place. Strategies updated to
link to Levels of Service
· Review existing emergency management/response and
disaster recovery plans and include in Asset Management Plans as required
· Develop and review standard technical specifications
for all asset classes
· Review current contract administration and procurement
procedures and ensure that the Parramatta Council project management framework
is implemented across all asset classes
· Ensure performance requirements in contracts are
linked to Levels of Service and performance targets
· Develop and implement internal and external service
level agreements to guide operations/ maintenance service delivery
· Identify critical assets for all asset classes
· Develop written procedures for condition monitoring/
inspection systems for critical assets
Information Systems
· Continue with the upload of data into Tech One and
start to use the asset management software solution to collect and manage asset
data in a form that is able to be used in determining the strategic framework
for the management of Parramatta’s assets
· Develop and document a plans/records management system
to keep track of the asset records including acquisition data plans of upgrades
or modifications etc
· Implement Tech One asset management and maintenance
(AM&M) system for maintenance/ works management and managing transactions
(including work orders, job costing, budget management and cost
allocation/tracking)
· Continue to develop the utilisation of the GIS spatial
system for displaying asset data and information for all assets down to asset
component level as appropriate
· Develop and implement asset rationalisation procedures
for all assets; include examining asset usage and appropriateness of the assets
in managing asset lifecycle planning
· Implement asset based works orders system and ensure
integration with the financial system so that the true cost of maintaining
assets can be determined
· Review and document system access and security
arrangements for the asset management system, so that as a minimum all staff
has viewing rights to the data and the ability to change data is restricted to
staff at an appropriate level
· Provide systems training and facilitate systems skills
development on an ongoing basis
Organisational / Commercial Context
· Review and update the Asset Management Strategy in
accordance with the Integrated Planning and Reporting guidelines
· Continue the corporate commitment to asset management
including a focus on infrastructure renewal and long term financial strategies
and programs
· Develop Asset Management Status reporting processes
for reporting to the Executive Team, Asset Owners, and Asset Custodians
· Develop a consistent set of written corporate
procedure for asset management monitoring/reviews
· Develop and implement basic asset management
benchmarking processes including industry and local/regional Council
benchmarking
· Ensure asset management continues to have a strong
corporate focus and support; engage corporate team in asset management
development; inform and educate Councillors about asset management
· Review/clarify asset management roles/
responsibilities across all asset classes where possible consistency of roles
should be paramount. Typically asset roles should be defined as Asset Owner,
Asset Custodian, Service Provider and Asset Maintainer, these roles should be
consistent across the organisation and individual asset classes
· The Strategic Asset Management group be appropriately
staffed with three positions reporting directly to the Strategic Asset Planner.
These positions should be consistent with the roles defined in the Gap Analysis
Report
· Asset management training program developed and
implemented for asset management staff and support staff
· Asset management awareness programs developed and
implemented for corporate team and elected representatives
6.13.3 Monitoring
and Review Procedures
This Strategic Asset Management Plan will be reviewed
during annual budget preparation and amended to recognise any changes in
service levels and/or resources available to provide those services as a result
of the budget decision process.
This
Strategic Asset Management Plan covers a period of ten years.