17/05/2012 4:31:23 PM
Draft Delivery Program 2010-14 Draft Operational Plan 2012-13 Delivering on the
Community Vision
17/05/2012 4:31:23 PM
Draft Delivery Program 2010-14 Draft Operational Plan 2012-13 Delivering on the
Community Vision
Contents
Lord
Mayor’s Message................................................................................................................................. 3
CEO’s
Message.................................................................................................................................................. 5
About
Parramatta’s 4-year Delivery Program 2010-14 and 1-year Operational Plan
2012-13..................................................................................................................................................................... 7
Parramatta Twenty25: What is it?........................................................................................................... 8
ABOUT
PARRAMATTA........................................................................................................................................ 10
Council’s Delivery Program 2010-14................................................................... 11
Environment & Infrastructure............................................................................................................. 12
Community & Neighbourhoods................................................................................................................ 17
Economy & Development.......................................................................................................................... 24
Governance & Corporate....................................................................................................................... 34
Council’s Operational Plan 2012-13.................................................................... 46
Environment & Infrastructure............................................................................................................. 47
Community & Neighbourhoods................................................................................................................ 51
Economy & Development.......................................................................................................................... 55
Governance & Corporate....................................................................................................................... 60
Financial Management Framework (Resourcing Strategy) ................................................ 63
2012-13 Budget................................................................................................................................................. 69
Income & Expenditure Estimates.......................................................................................................... 72
Rates, Fees & Charges (Schedule of Fees & Charges
included under separate cover) ................................................................................................................................................................. 83
The Delivery Program was created to provide the
basis for Council’s spending over a four-year period, to enable us to focus on
delivering quality services to the
We have strived to maintain
One of our primary goals in the coming year will be
to conduct a feasibility study for a light rail system from the Hills, into
Of primary importance is our Operational Plan,
which delivers 41 core services to the community each year. In 2012/13
Council will spend $146 million on Operating projects and services (excluding
depreciation) and $54.6 million on specific capital projects.
Breaking this
down, our Operating Expenditure includes:
· Roads, footpaths and drainage - $12.8 million
· Waste and Sustainability Programs - $19.0 million
· Parks and Open Space - $10.9 million
· Children and Family Services - $4.0 million
· Community, Youth and senior services - $4.2 million
· Library services - $6.6 million
· Property development - $4.2 million
· Development & traffic services - $7.0 million
· Parking facilities - $4.5 million
· Arts and culture - $5.5 million
· Tourism and events - $5.3 million
· Recreation facilities and programs - $6.1 million
· Corporate management and Councillor services - $5.6
million
· Trades and fleet management - $3.1 million
· Human resources management - $4.1 million
· Natural areas management - $1.7 million
In 2012/13 Council
proposes to spend about $54.6 million on capital projects. This includes a
significant allocation for projects to position
Council has
allocated $0.875 million for project management of
We continue to
focus on our core business of maintaining and repairing roads. We have budgeted
$5.1 million for this, along with $1.2 million for the continuation of the
Pedestrian Access and Mobility Program (PAMP).
Maintaining our
parks and recreation facilities is also important – $17 million has been
allocated for their upgrade and maintenance.
The Neighbourhood
Improvement Program will continue, with a budget of $1.49 million.
Council is well on
its way to making
Lord Mayor of
Councillor
CHIEF EXECUTIVE OFFICER’S MESSAGE
It has been another busy
year for Parramatta City Council and the City, one that has seen major
developments such as the Eclipse tower rise to transform the CBD skyline, and
one that has seen Parramatta positioned front and centre of discussions about
the future of Greater Sydney.
As the central city of
Parramatta City Council has
taken a lead agency role in lobbying the government to consider various options
to improve transport infrastructure in the west. We have called for more
relocation of government services to
Council has prepared for
this. When we created our four-year Delivery Program we undertook a major
review of services to make sure we were delivering the right services in a
financially sustainable way.
Now we are more than half
way though the delivery of this program and we are starting to see the benefits
of these efficiencies.
As we enter the last half
of this planning cycle, we are looking even further ahead to the future to make
sure we are adequately planning for the future needs of our City.
The Delivery Program and
Operation Plan help us meet our long-term goals, which are outlined in our
Community Strategic Plan, Parramatta Twenty25.
In the coming year, we are
thoroughly reviewing this plan to make sure we are meeting the challenges and
opportunities that are emerging around us.
While we work on this
aspirational document, we will continue to roll out our current Delivery
Program, which outlines Council’s role in achieving our objectives for the
city.
Council organises its
activities and projects into four categories that we call pillars:
· Environment and Infrastructure
· Community and Neighbourhoods
· Economy and Development
· Governance and Corporate
Environment and
Infrastructure
One of our key objectives
is helping people and places to be linked by sustainable transport and
communication networks, and this remains a key focus in the coming year. We
will create more cycleways and provide more bike facilities and boost
pedestrian safety along busy roads.
Restoring natural areas and
waterways also remains a high priority, providing safer, healthier and
attractive spaces for residents to enjoy.
Community and
Neighbourhoods
Council strives to sustain
liveable neighbourhoods that are distinctive, diverse, safe and cohesive.
In the coming year budget
will be on developing and improving our parks and recreation facilities,
maintaining our public halls and community centres, and continuing the
operation of pools and sportsgrounds. We have improved access to our pools by
offering a free access day for pensioners and a free family pass to our
residents.
Economy and Development
Council is progressing the
development of several key sites in the CBD, not least of which is
Council has progressed the
development of a new Operations Centre to replace its aging depot sites, with
work likely to start in the coming financial year.
Expressions of interest
have been sought for the development of two key sites – the current
We have strived to build a
reputation for
Importantly, we continue to
work with external stakeholders to develop areas such as Rydalmere and Camelia
as thriving industrial precincts, and Westmead as our world-class biomedical research
precinct.
Governance and Corporate
Council has started to reap
the benefits of its major Services Review in 2010, with identified savings of
$2.6 million made in the first year alone, on top of previously identified
improvements.
This exercise has evolved
into an on-going Continuous Improvement and Innovation Program, which is
imbedded throughout the organisation as part of our day-to-day business.
We aim to be an employer of
choice and recently scored a very favourable 74% staff engagement result. Our
aim is to reach 80%, which would place Council in the country’s top 200
organisations.
We have supported staff by
rolling out a new salary system and new Employee Annual Assessment and
Development Plan to engage staff and encourage innovation. We have embedded new
training opportunities through employing a new MyLearning tool.
We continue to drive ‘smart
city’ innovations in our organisation through our e-Parra program. Through this
program we have deployed new and innovative technology to make our business
more effective and efficient.
Finance
We have previously reported
that there was an unsustainable gap between our operating expenditure and
revenue, which drove the need for our Future Pathways strategy and the
implementation of our comprehensive Services Review. I am pleased to announce
that the saving from our review and the introduction of a modest, phased rate
increased plus other cost saving measures means we are now closing the gap and
are on track to hit a break even budget by 2014/15.
It is important to note
that this has been achieved without cutting any frontline services.
Better still, we have used
our reviews to focus on improving performance in four areas – finance, customer
service, internal processes and business – which are already starting to show
positive financial returns.
DR ROBERT LANG
CHIEF EXECUTIVE OFFICER
About
In
2010 Council adopted its first 4-year Delivery Program which outlined the activities
to be undertaken by Council from 2010 to 2014 to achieve the delivery of
The Delivery Program is
regularly reviewed and some changes have been made to accommodate changing
circumstances and emerging opportunities. There has been no change however to
the overriding direction of the Program - to deliver the objectives of
Parramatta Twenty25 in a financially sustainable manner.
Supporting
this Delivery Program is a 1 year Operational Plan. It spells out the details –
the individual projects and activities - that will be undertaken by Council in 2012-13.
To
deliver these, Council has 24 service areas that are linked to the 7 external
strategic objectives (or destinations) in Parramatta Twenty25 and the 4
internal strategic objectives outlined in Council’s Corporate Plan. For the
purpose of this planning and reporting framework, these are grouped under 4
pillars:
· Environment
& Infrastructure
· Community
& Neighbourhoods
· Economy &
Development
· Governance & Corporate
Council
has also prepared a Resourcing Strategy which includes a Long Term Financial Plan,
Asset Management Plan, Workforce Management Plan and Information, Communication
& Technology Plan. The
Delivery Program and Operational Plan have informed and been informed by the
Resourcing Strategy.

Parramatta Twenty25 is the Community Strategic Plan
for the
Parramatta Twenty25 provides an agreed agenda and a
clear long term direction for
There are seven strategic objectives or destinations
identified in Parramatta Twenty25 for the city:
1. Land and
Water that is protected, respected and sustained
2. A society
that is healthy and compassionate
3. Businesses
that are dynamic, prosperous and socially responsible
4. Neighbourhoods
that are liveable and distinctive
5. A community
that is diverse and cohesive
6. People and
places that are linked by sustainable transport and communication networks
7. A city that
is innovative and inspirational
These destinations have 34 strategies that are
designed to support and achieve the destinations.
|
Item
11.3 - Attachment 1 |
Draft Updated 2010/2014 Delivery Program
and Draft 2012/13 Operational Plan
(Distributed under separate cover to Councillors and Senior Staff. For
a copy pls contact council support on 98065314) |
How the Community’s and Organisation’s
strategic objectives link to Council’s service areas
|
Plan |
Strategic Objectives |
Service Areas |
Included in these service areas |
|
Community Strategic Plan – |
Environment & infrastructure Land and water that is
protected, respected and sustained People and places linked
by sustainable transport |
§ Roads, Footpaths & Drainage § Parking Facilities § Waste & Sustainability Programs § Trades & Fleet Management § Natural Areas Management § Cleansing Services |
§ Civil assets maintenance & construction § Public asset audit, footpath construction & maintenance § Cleansing services § Civil asset management § Capital projects § Paid parking major contracts § Waste management major contracts § Facilities & trades § Fleet services § Natural areas management |
|
Community & Neighbourhoods A society that is healthy
and compassionate Neighbourhoods that are
liveable and distinctive A community that is
diverse and cohesive |
§ Children & Family Services § Community, Youth & Seniors’ Services § Parks & Open Space § Arts & Culture § Library Services § Recreation Facilities & Programs |
§ Home support & community services § Children & family services § Library services § Community capacity building § Community safety & crime prevention § Open space management § Parks maintenance § Recreation facilities & programs § Arts facilities & cultural programs (includes Artist Studios) § Riverside Theatres & Connection Studios |
|
|
Economy & Development Businesses that are
dynamic, prosperous and socially responsible A City that is innovative
and inspirational |
§ Tourism & Events § Property Development § Regulatory Services § Development & Traffic Services § Town Planning & Urban Design § City Strategy & Place Services |
§ Heritage & visitor information § Tourism development § Events § Civic Place & other property development § Community law & education § Environmental health & protection § Development assessment § Planning certificates § Certification § Land use planning & S94 management § Urban design services § City strategy (economic, environmental & social policy & planning,
place management & corporate planning) § Transport planning § Traffic facilities management |
|
|
PCC Corporate Plan |
Governance & Corporate A well governed and led
organisation that is service and community focused and communicates
effectively Engaged and valued staff
working effectively to improve the way we do business Responsive and best
practice management of Council’s finances, risk, procurement and assets An organisation that plans
its future, improves systems & processes, measures its success and
compares its performance to others |
§ Corporate, Governance & Councillor Services § Finance Management § Human Resources Management § Information Communication & Technology § Customer Relations & Communications § Strategic Asset & Property Management |
§ Executive management § Governance, quality, corporate performance § Councillor support, civic events § Audit & legals § Finance, procurement, payroll, rates, insurance & risk § Human resources § Information technology § Customer contact centre, research & consultation, website & business
information services § Marketing & communication § Asset & property management |
ABOUT
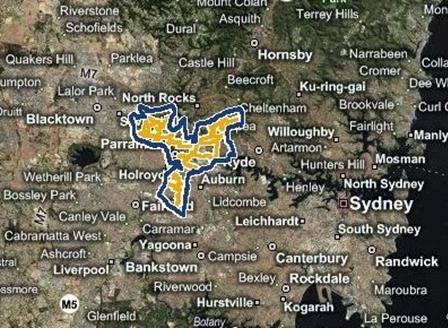
The Australian Bureau of Statistics estimated
Parramatta City includes the suburbs of Camellia,
Carlingford (part), Chester Hill, Clyde, Constitution Hill, Dundas, Dundas
Valley, Eastwood, Epping (part), Ermington, Granville (part), Guildford (part),
Harris Park (part), Melrose Park (part), Merrylands (part), North Parramatta
(part), Northmead (part), Oatlands (part), Old Toongabbie, Parramatta (part),
Pendle Hill (part), Rosehill, Rydalmere, South Granville, Telopea, Toongabbie
(part), Wentworthville, Westmead (part) and Winston Hills.
The City encompasses a total land area of about 61 square kilometres.
Council’s Delivery Program 2010-14
Council’s
services that focus on Environment and Infrastructure work to:
Ø Maintain
local roads and associated infrastructure and enhance cycleway and pedestrian
networks
Ø Promote
road safety and efficient traffic network through transport planning, parking
and traffic facilities
Ø Minimise
impacts associated with flooding
Ø Provide
waste and street cleaning services to ensure the health and safety of the City
and maintain its appearance
Ø Conserve
and protect the natural systems and resources within the City
Ø Support
Council service delivery through provision of trade and fleet services.
Key
Challenges for the next 5 years:
Ø Ageing infrastructure – asset
maintenance and renewal
Ø Infrastructure expansion to
address population growth and changed conditions, particularly new technology
Ø Potential for increased
negative impacts on the environment from population growth including increased
waste, air pollution, stormwater run-off and consumption of resources
Ø Erosion of waterways
including damage to sea walls in the Parramatta River
Ø Extreme weather events
including drought and floods
Ø Long term management of waste
and improved environmental outcomes through waste reduction
Ø Connecting bushland and
waterways corridors through public and private land
Ø Finding new community
volunteers to get involved in bushland and other environmental programs.
Ø People and places that are linked by
sustainable communication networks
Ø Council assets that are
sustainable.
|
The key strategic
objectives in Parramatta Twenty25 ( Ø Land
and water that is protected, respected and sustained Ø People
and places that are linked by sustainable transport |
To
deliver these objectives, Council will use partnerships, advocacy, projects
and/or service delivery to deliver the following strategies: Ø protect
and rehabilitate high priority waterways and manage major impacts on medium
and low priority waterways Ø protect
and rehabilitate core bushland areas and manage major impacts on corridors and
remnant bushland Ø reduce
human impacts on Parramatta’s unique diversity of plants and animals Ø protect
and manage significant natural landscape features and soil types Ø reduce
the risk to the community due to natural or human made disasters Ø reduce
the consumption of non-renewable and scarce resources Ø facilitate
the sharing of information and ideas through remote communications Ø manage
road congestion and safety while reducing the reliance on car use as a
primary means of transport Ø increase
the number of people using public transport, particularly for journeys to
work Ø increase
the number of people walking and cycling, particularly for journeys within
the neighbourhood Ø refurbishment
of new buildings to incorporate sustainable and environmentally appropriate
elements wherever possible Ø new
buildings to be developed by PCC to incorporate a high level of
sustainability. |
Council’s
services that are linked to the delivery of these objectives are:
|
Service
Area |
Included
in this service |
Purpose
(what we do) |
Key
Outputs (how we do it) |
Service
Outcome (why we do it) |
|
Natural
Areas Management |
Natural areas management |
Management of bushland and riparian areas within
the open space network. |
Asset management strategies and plans. Contract management. |
Maintain and improve the natural areas network to
an agreed standard. |
|
Roads,
Footpaths and Drainage |
Civil assets maintenance and construction |
Maintain civil infrastructure Construct minor civil infrastructure. |
Contract and in-house civil works construction,
assessment and maintenance |
Safe and functional infrastructure for public
use. |
|
Public asset audit, footpath construction &
maintenance |
Audit the public domain. |
Contract and in-house public domain asset
construction, assessment and maintenance. |
Safe and functional public domain |
|
|
Civil Asset Management |
Management of built infrastructure in the public
domain. |
Asset Management Strategies and Plans. |
Maintain public assets to an agreed standard. |
|
|
Capital Projects |
Design and construct capital works to provide
infrastructure and public space. |
Design, construction and project management. |
Provide new or upgraded public assets. |
|
|
Trades
& Fleet Management |
Facilities & Trades |
Provide technical support and management to
units of council so as to assist them in the maintenance of the facilities
they occupy. |
Repairs and maintenance works undertaken.
Production of street signs and banners as well as graffiti removal. |
Support delivery of a wide range of efficient
Council services, ensure building regulation compliance and improved City
presentation. |
|
Fleet services |
Provide plant and vehicles for Council use in
delivering services. |
Purchase, maintenance and disposal of plant and
fleet. |
Effective and functional fleet to support
service delivery. |
|
|
Parking
Facilities |
Paid parking major contracts |
Management of the contract for operation of
multi level car parks and the contract for maintenance and cash collection of
parking meter machines. |
Contract management. |
Manage parking in the CBD. |
|
Waste
& Sustainability Programs |
Waste management |
Management of contracts for collection and
processing of domestic garbage, recyclables and organic and commercial waste. |
Contract management Residential & commercial garbage collection Residential bulk clean up collection. |
Public health and safety and improved environmental
outcomes through waste reduction and resource recovery. |
|
Cleansing
Services |
Cleansing service |
The cleaning and removal of litter from public
land and places. |
Street sweeping. Litter collection & Waste removal. Cleaning stormwater
pits. |
Public land is maintained in a clean and safe
condition. |
Key
Actions for Council 2010-14
|
Service
Area |
2010-11 |
2011-12 |
2012-13 |
2013-14 |
|
Natural
Areas Management |
Ø Implement
priority works under Natural Area Management plans including weeding and bush
regeneration works. |
Ø Enhanced
river/stream care - water quality Ø Expand
bushwalking tracks in core areas |
Ø Green
the CBD (extensive tree planting) Ø Increase
community involvement in environmental restoration projects. |
Ø Increase
community involvement in environmental restoration projects. |
|
Roads,
Footpaths & Drainage |
Ø Further
develop Strategic Asset Management Plan for civil infrastructure Ø Implement
priority works under Pedestrian Access Mobility Plan Ø Implement
priority works through road restoration and rehabilitation program Ø Commence
condition assess of bridges Ø Increase
maintenance of stormwater assets Ø Energy
efficient street lighting Ø Stormwater
re-use strategies – strategy. |
Ø Implement
priority works under Pedestrian Access Mobility Plan Ø Implement
priority works through road restoration and rehabilitation program Ø Stormwater
asset replacement - resulting from asset data capture project Ø Fundamental
review. Assess impact of developments
on infrastructure e.g. stormwater drainage Ø Incorporate
climate/social mitigation and adaptation principles into all infrastructure
planning Ø Stormwater
re-use strategies – strategy. |
Ø Implement
priority works under Pedestrian Access Mobility Plan Ø Implement
priority works through road restoration and rehabilitation program Ø Stormwater
re-use strategies – strategy |
Ø Implement
priority works under Pedestrian Access Mobility Plan Ø Implement
priority works through road restoration and rehabilitation program Ø Stormwater
re-use strategies – strategy. |
|
|
Ø Bus
stop improvements Ø Park
and ride – promotions. Ø Improve
shared use cycleway connections including Parramatta Valley Cycleway |
Ø Program
of sustainable transport initiatives (car share, car pool, travel plans,
commuter, cycle events Ø Review
parking charges (increase), linked to environment impact Ø Implement
aspects of adopted Integrated Transport Plan. |
Ø Implement
aspects of adopted City Centre Parking Strategy and Integrated Transport
Plan. Ø Continue
to implement bike network Ø Western
Sydney Light Rail feasibility study Ø Western
Sydney and City Centre Ring Roads |
Ø Respond
to State Government initiatives Ø Implement
aspects of adopted City Centre Parking
Strategy and Integrated Transport Plan. |
|
Waste
& Sustainability Programs |
Ø Management
of contracts for collection and processing of kerbside material. Ø Enhance
recycling of kerbside cleanup materials. |
Ø Management
of contracts for collection and processing of kerbside material. Ø Re-tender
waste collection service. |
Ø Management of contracts for collection and
processing of kerbside material. Ø Develop and progressively
implement waste strategies to ensure waste to landfill is significantly
reduced and resource recovery is optimised. Ø Review
and update Council’s Waste Avoidance and Resource Recovery Plan. |
Ø Management of contracts for collection and
processing of kerbside material. Ø Develop and progressively implement waste
strategies to ensure waste to landfill is significantly reduced and resource recovery is
optimised. |
Key
performance measures
|
Resident
satisfaction measures |
Target |
Reporting
Frequency |
|
Percentage of resident satisfaction with the
condition of Council managed roads |
50% satisfied or very satisfied |
Annual |
|
Percentage of resident satisfaction with street
signage |
70% satisfied or very satisfied |
Annual |
|
Percentage of resident satisfaction with the
condition of cycleways |
55% satisfied or very satisfied |
Annual |
|
Percentage of resident satisfaction with the
condition of footpaths |
45% satisfied or very satisfied |
Annual |
|
Percentage of resident satisfaction with the
condition and maintenance of bus stops |
65% satisfied or very satisfied |
Annual |
|
Percentage of resident satisfaction with Council
promotion of sustainable transport |
50% satisfied or very satisfied |
Annual |
|
Percentage of resident satisfaction with
Council’s management of bushland under its care and control |
70% satisfied or very satisfied |
Annual |
|
Percentage of resident satisfaction with Council
waste collection services |
80% satisfied or very satisfied |
Annual |
|
Percentage of resident satisfaction with the
cleanliness of streets, parks and public spaces |
75% satisfied or very satisfied |
Annual |
|
Percentage of resident satisfaction with
Council’s management of human impacts on the environment |
50% satisfied or very satisfied |
Annual |
|
Percentage of resident satisfaction with Council
efforts to increase recycling |
65% satisfied or very satisfied |
Annual |
|
Percentage of resident satisfaction with
cleanliness of waterways |
50% satisfied or very satisfied |
Annual |
|
Other
measures |
Target |
Reporting
Frequency |
|
Road pavement condition index (PCI) |
6.4 |
Annual |
|
Number of metres of new footpath installed |
5,700 metres |
Annual |
|
Length of stormwater system with upgraded
capacity |
600 metres |
Annual |
|
Number of drainage pits with upgraded capacity |
25 |
Annual |
|
Number of new pedestrian crossings installed |
5 |
Annual |
|
Average response rate (days) to customer requests
regarding pollution incidents |
10 |
Quarterly |
|
Length of waterways under Council control that
are rehabilitated |
18 kilometres |
Annual |
|
Percentage rate of diversion of residential waste
from landfill |
43% |
Annual |
Community & Neighbourhoods
Council’s services that
focus on Community and Neighbourhoods work to:
Ø Improve the social wellbeing
of our communities, particularly those most in need
Ø Enhance the capacity of the
community and non-government organisations working in Parramatta
Ø Maintain and enhance the
community’s actual and perceived safety
Ø Broker partnerships with
community and government agencies to maximise services available
Ø Address needs identified in
planning documents relating to homelessness and affordable housing
Ø Provide and maintain a
network of open space and recreation facilities throughout the City that
promote a variety of active and passive recreational opportunities for
residents, workers and visitors
Ø Provide library and
information services to develop, support and promote community knowledge and
learning opportunities
Ø Develop, support and promote a diversity of quality
arts programs and venue that build the cultural capacity of the City
Key Challenges for the next 5 years:
Ø Responding to population growth
and changing community needs
Ø Health e.g. addressing inequality
in health outcomes and increasing demand for mental health services
Ø Improving housing affordability
and reducing homelessness
Ø Reducing negative impacts of
social inequality on individuals and communities
Ø Increasing both actual and
perceived community safety
Ø Promoting social sustainability
Ø Stress on the Not for Profit
Sector e.g. capacity building “of the community”
Ø Decreasing funding for
community services.
|
The key strategic objectives in Parramatta
Twenty25 ( Ø A society that is healthy and compassionate Ø Neighbourhoods that are liveable and distinctive Ø A community that is diverse and cohesive. |
To deliver these
objectives, Council will use partnerships, advocacy, projects and/or service
delivery to deliver the following strategies: Ø fulfil Parramatta’s regional responsibilities by
providing high level services to western Sydney Ø improve the health of Parramatta’s community by
encouraging healthy lifestyles Ø develop a range of education opportunities to
meet the needs of Parramatta’s community Ø develop affordable housing and accommodation to
meet the needs of Parramatta’s residents Ø improve the quality of life for people who are
requiring support Ø assist people to gain employment by providing
access to skills development and other support Ø plan for concentrated growth of housing around
transport and activity nodes rather than dispersed growth throughout the LGA Ø encourage business to locate and prosper in
neighbourhood centres Ø reduce incidence of crime and ensure that
Parramatta is perceived as a safe place by day and by night Ø improve the integration of natural and built
environments Ø create clean and attractive streets and public
places particularly around neighbourhood centres Ø provide local opportunities for recreation,
leisure and sport Ø create a strong sense of neighbourhood identity Ø acknowledge and respect the Aboriginal community
as the traditional custodians of Parramatta Ø protect and celebrate Parramatta’s rich
multi-layered built and cultural heritage Ø support and promote
community groups which create community interaction and cohesion. |
Council’s
services that are linked to the delivery of these objectives are:
|
Service
Area |
Included
in this service |
Purpose
(what we do) |
Key
Outputs (how we do it) |
Service
Outcome (why we do it) |
||
|
Children & Family Services |
Children & Family Services
(child care services & facilities) |
Ø Provide
facilities, staff & support to implement Children’s Services programs for
the benefit of families & children. |
Ø High
quality early learning services. |
Ø Children
cared for in safe and supportive environments. Ø Early
learning and development results in children with a firm basis for success in
life. |
|
|
|
Arts
& Culture |
Arts Facilities and Cultural Programs |
Ø Manage
and facilitate the provision of quality and accessible arts facilities and
cultural programs for the City. |
Ø Providing
Parramatta Artist Studios and coordinating Arts policy and programs Ø Providing
affordable and accessible opportunities for production, presentation and
participation in arts and culture. |
Ø To
promote the City as a creative and vibrant place Ø To
emphasise and challenge experiences of the historical and contemporary
cultural heritage of the City. |
|
|
|
Riverside Theatres and Connection Studios |
Ø Manage,
co-ordinate and transact the business and administrative requirements of
Riverside’s venue hire and performance venture activities. |
Ø Providing
a diverse theatre program Ø Supporting
development of new cultural products Ø Supporting
professional development of artists Ø Providing
a venue for community events. |
Ø To
promote the City as a creative and vibrant place. Ø To
develop awareness and understanding of Parramatta’s cultural heritage and
identity. Ø To
provide social, cultural and leisure benefits to individuals and communities. |
|
||
|
Community, Youth & Seniors’ Services |
Home support &
community services (aged & disability services) |
Ø In
partnership with Government and non-Government organisations, manage a range of
targeted aged and disability services across the LGA to meet the needs of the
community. |
Ø Social
support Ø Health
promotion Ø Lawn
mowing Ø Support
to carers Ø Low
cost nutritional meals. |
Ø Improve
the quality of life for older people and those with disabilities and enable
them to remain in their homes. |
|
|
|
Ø Build
capacity of individual residents and their communities to actively engage and
self advocate. Ø Work
with Council, communities and the third sector to act as a catalyst for
positive social change to build strong sustainable communities. |
Ø Deliver
community events Ø Administer
Community grants program Ø Attract
external grants for social support/inclusion to Parramatta agencies Ø Active
community groups supporting social service/inclusion in Parramatta. |
Ø Community
members as positive participants and leaders in building and implementing
community goals locally. Ø Community
organisations which are strong and strategically focussed to understand and
meet local community need. |
|
|||
| Community Safety & Crime Prevention |
Ø Development
and implementation of crime community crime prevention strategies. |
Ø Crime
prevention measures including CCTV, CPTED and liaison with Police |
Ø Improved
perception of safety in our City |
|
||
|
Parks & Open Space |
Open Space Management |
Ø Plan
for the efficient management and enhancement of Council’s open space and
recreation areas. |
Ø Implement
Asset Management Strategies and Plans to construct and maintain open space
assets. |
Ø Maximise
the wide range of individual and community benefits derived from Council’s
open space assets. |
|
|
| Parks Maintenance |
Ø Maintain
and improve Council’s open space and recreation areas. |
Ø Contract
and in-house parks maintenance including mowing, gardens and nursery. |
Ø Well
maintained and safe parks and reserves. |
|
||
|
Library
Services |
Library Services |
Ø Deliver
quality Library services that respond to the communities needs for
information, learning and leisure. |
Ø Providing
libraries and maintaining library collections Ø Provide
access to technology and to recreational and educational programs for the
community. |
Ø To
provide a gateway to life-long learning, recreation and information
opportunities to support a high quality of life. |
|
|
|
Recreation
Facilities & Programs |
Recreation facilities
& programs |
Ø Provide
access to a range of quality community recreation and
leisure facilities that meet the needs of the community Ø Provide
management, development and support for a range of recreation
programs. |
Ø Management
of Granville and Parramatta Pools, Granville Youth and Community Recreation
Centre, Woodville Golf Course and Council’s tennis facilities and associated
recreation programs. |
Ø Socio-economic
benefits, enhanced life skills and improved levels of physical fitness and
health. Ø Secondary
effects include higher educational standards, more prosperous local economies
and stronger, safer communities in which everyone can make a contribution. |
|
|
Key
Actions for Council 2010-14
|
Service Area |
2010-11 |
2011-12 |
2012-13 |
2013-14 |
|
Children & Family
Services |
Ø Develop and implement the NSW
Early Learning Years Framework (ELYF) across Council’s Early Learning Centres |
Ø Develop and implement the NSW
Early Learning Years Framework (ELYF) across Council’s Early Learning Centres |
Ø Implement the Education and Care Services National Regulations
across the Early Learning Centres. |
Ø Develop an Implementation Plan for the next stage of
the Education and Care Services National Regulations across
the Early Learning Centres. |
|
Arts & Culture |
Ø Establish professional ongoing performance
production unit for Riverside Theatres Ø Negotiate new funding arrangement with State
& Federal Governments for Riverside Theatres Ø Clarification and development of a gallery Ø Implement the Parramatta Cultural Trust Ø Facilitate the development of arts/business
relationships – creative enterprise broker. Ø Negotiate new funding arrangement with State
& Federal Governments for Parramatta Artists Studios Ø Review Arts Facilities and Cultural Places
framework |
Ø Promote cultural and creative industries Ø Review Arts Facilities and Cultural Places
framework Ø Develop both short and long term development
plans to enhance Riverside Theatres complex Ø Develop a mini-festival at Riverside Theatres Ø Facilitate expanded arts precinct and confirm
Councils role in the development and future operations of the Old Kings
School precinct Ø Negotiate
new lease for Parramatta Artists Studios or relocate to Old Kings School |
Ø Develop promotional signage for Riverside
throughout Parramatta City Centre Ø Refurbish Riverside foyers Ø Seek funding for development of Riverside
Theatres. Ø Seek funding for Parramatta Artists Studios Ø Seek ongoing commitment for the Creative Broker
position and for Pop Up Parramatta Ø Facilitate expanded cultural precinct and confirm
Council’s role in the development and future operations of the Old Kings
School precinct |
Ø Make Riverside technology best practice in
performance. Ø Facilitate expanded cultural precinct and confirm
Councils role in the development and future operations of the Old Kings
School precinct Ø Promote cultural and creative industries |
|
Community, Youth &
Seniors’ Services |
Ø Resource and support the
Parramatta Homelessness Interagency to develop its five year strategic plan
to reduce homelessness in Parramatta Ø Social Enterprise
identification and development Ø Community sector engagement
and skill building Ø Establish baseline Social
Wellbeing measure for Parramatta Ø Policy development around
health and wellbeing, physical activity Ø Develop integrated CCTV
Strategy and Policy Ø Develop LGA Crime Prevention
Plan Ø Develop Sex Services Premises
- Enforcement policy, standard operating procedures, Lobby State Govt for
Legislative Change Ø Not for Profit Governance and
Management Support Ø State of the community sector social research. Ø Access
to Community Facilities (links to Strategic Asset Management) |
Ø Support the implementation of
the Parramatta Homelessness Interagency’s Strategic Plan Ø Social Enterprise
identification and development Ø Community sector engagement
and skill building Ø Establish baseline Social
Wellbeing measure for Parramatta Ø Implement policy around
health and wellbeing, physical activity Ø Implement integrated CCTV
Strategy and Policy 2010 Ø Implement LGA Crime
Prevention Plan Ø Not for Profit Governance and
Management Support Ø Social Networking Pilot - integrating disadvantaged people into valued
activities. Ø Access to Community
Facilities (links to Strategic Asset Management) Ø Expansion of programs to
support young adults - HSC and Social and Health and Community Engagement Ø Programs to reach CALD
communities - outreach and in partnership with community partners NGO's. Ø Expansion of over 50's
Leisure and Learning Service across Parramatta. |
Ø Support the implementation of
the Parramatta Homelessness Interagency’s Strategic Plan Ø Social Enterprise
identification and development Ø Community sector engagement
and skill building Ø Implement ongoing measurement
against baseline social well being measure for Parramatta Ø Implement integrated CCTV
Strategy and Policy 2010 Ø Implement LGA Crime
Prevention Plan Ø Social Networking Pilot - integrating disadvantaged people into valued
activities. Ø Access to Community
Facilities (links to Strategic Asset Management) Ø Expansion of over 50's
Leisure and Learning Service across Parramatta. Ø Expansion of programs to
support young adults - HSC and Social and Health and Community Engagement Ø Expanding Exhibition and public program / education programs to engage
diverse communities, particularly those who are hidden. |
Ø Support the implementation of
the Parramatta Homelessness Interagency’s Strategic Plan Ø Social Enterprise
identification and development Ø Community sector engagement
and skill building Ø Implement ongoing measurement
against baseline social well being measure for Parramatta Ø Implement integrated CCTV
Strategy and Policy 2010 Ø Implement LGA Crime Prevention Plan. Ø Expansion of over 50's
Leisure and Learning Service across Parramatta. Ø Expansion of programs to
support young adults - HSC and Social and Health and Community Engagement Ø Expanding
Exhibition and public program / education programs to engage diverse
communities, particularly those who are hidden. Ø Access to Community Facilities (links to Strategic Asset Management) |
|
Parks & Open Space |
Ø CBD park upgrades |
Ø Stormwater re-use to
irrigate ovals Ø Development of an additional
playing field in the LGA |
Ø CBD park upgrades Ø Stormwater re-use to
irrigate ovals |
Ø CBD park upgrades Ø Development of a district
park Ø Stormwater re-use to
irrigate ovals. |
|
Library Services |
Ø Develop major web presence
for the Library Ø Development of community
literacy project - Paint Parra Read. |
Ø Develop and implement 24/7 reference
service and major web presence for library Ø Develop flexible service
delivery model for Library Ø Library collection
development focussed on ebooks and eresources Ø Provide online access to
collections Ø Implement new technology for
visitors experience - pod casts tours Ø Renovation of branch
libraries to create environmentally sustainable welcoming community spaces Ø Development of community
literacy project - Paint Parra Read |
Ø Develop and implement new
Library management system Ø Provide online access to
collections Ø Programs to reach CALD
communities - outreach and in partnership with community partners NGO's Ø Renovation of branch
libraries to create environmentally sustainable welcoming community spaces |
Ø Provide online access to
collections Ø Programs to reach CALD
communities - outreach and in partnership with community partners NGO's Ø Renovation of branch
libraries to create environmentally sustainable welcoming community spaces |
|
Recreation Facilities
& Programs |
Ø Facilities audit mapped
against / to recreation guidelines linking to transport Ø Accessibility
of facilities e.g. public halls, community centres, sports grounds and
programs. |
Ø Technology enhancements to
facilities to allow online, cashless booking Ø Increased non-structured
recreational facilities within parks Ø Enhancements
to Woodville Golf Course Ø Facilities audit mapped
against / to recreation guidelines linking to transport Ø Accessibility
of facilities e.g. public halls, community centres, sports grounds and
programs. Ø Refurbishment
of Parramatta Town Hall roof |
Ø Facilities to allow online,
cashless booking – further development & enhancement of systems Ø Advocate for accessible
facilities e.g. gyms Ø Feasibility study indoor
sports centre Ø Aquatic dome to assist in
the development of Swim School / L2S Ø Refurbishment of Parramatta
Town Hall roof Ø Review of the Sport and
Recreation Plan Ø Refurbishment and upgrade of
tennis courts at Caroline Chisholm |
Ø Audit and delivery of a
Tennis Facility Strategy Ø Feasibility study indoor
sports centre Ø Feasibility of
installation of Aquatic dome to assist in the development of Swim School
/ L2S |
Key
performance measures
|
Resident
satisfaction measures |
Target |
Reporting
Frequency |
|
Percentage of residents who feel safe in the city
and local areas |
City Centre 73% Local Areas 76% |
Annual |
|
Percentage of resident satisfaction with the
quantity and quality of Council owned/managed recreation facilities and
opportunities in the City |
63% satisfied or very satisfied with quantity and
61% quality |
Annual |
|
Percentage of resident satisfaction with the quality
of library services |
73% satisfied or very satisfied |
Annual |
|
Percentage of resident satisfaction with
Riverside Theatres |
65% satisfied or very satisfied |
Annual |
|
Other
measures |
Target |
Reporting
Frequency |
|
Percentage of people receiving Council provided
human services compared to registered demand |
% |
Annual |
|
Percentage of users satisfied with Child Care
services |
93% |
Annual |
|
Percentage of users satisfied with Home Support
services |
92% |
Annual |
|
Percentage of community based support
organisations who are satisfied with the support provided by Council |
% satisfied or very satisfied |
Annual |
|
Percentage of user group satisfaction with the
quantity and quality of Council owned/managed recreation facilities and
opportunities in the City |
81% satisfied or very satisfied with quantity and
93% quality |
Annual |
|
Percentage of user satisfaction of recreation and
sports organisations with support provided by Council |
72% |
Annual |
|
Percentage of user satisfaction with the quality
of library services |
85% |
Annual |
|
Percentage of user satisfaction with the
accessibility of library services |
85% |
Annual |
|
Percentage of user satisfaction with the
availability library services |
81% |
Annual |
|
Number of visits to Council’s libraries |
804,300 |
Annual |
|
Number of visits to Council’s library website |
87,200 |
Annual |
|
Number of events and exhibitions at Riverside
Theatres |
700 |
Annual |
|
Average level of attendance at Riverside Theatres |
110,000 |
Annual |
|
Percentage of client satisfaction at Riverside
Theatres |
90% |
Annual |
Council’s services that
focus on Economy and Development work to:
Ø Support,
develop and promote opportunities for sustainable business growth and
improvement
Ø Attract
visitors to Parramatta
Ø Improve
the way Parramatta looks and works by enhancing public spaces and regenerating
the City Centre and neighbourhood centres
Ø Express
and promote the City’s identity by organising events and festivals that engage
and reflect the entire Parramatta community
Ø Know,
value and care for the City’s rich cultural heritage
Ø Maintain
and improve the safety and amenity of Council residents, community and the
environment by appropriately enforcing the relevant Acts and Regulations
Ø Effectively and equitably
regulate the development and use of land.
Ø Promote quality urban design and sustainable land use
management within the Parramatta Local Government Area.
Key Challenges for the next 5 years:
Ø Promote
employment growth
Ø Harnessing
the opportunities of human capital/knowledge based employment
Ø Target
industry/employers to locate to Parramatta
Ø Protection
of employment lands to ensure sustainable growth
Ø Creating
a city with positive amenity/culture/buzz and target younger workers
Ø Redevelopment
of key council owned lands including Civic Place
Ø Identifying
appropriate lands for targeted industries
Ø Managing
population growth and identifying appropriate land for new sustainable
development
Ø Address
the negative safety perceptions of Parramatta
Ø Developing and marketing
the City's
brand (how residents, workers and visitors identify with the city).
Ø Creating a city that is resilient to climate
extreme
Ø Developing a green economy within the City
Ø Ensuring that services meet the needs of a diverse
community, considering the issue of affordable housing and homelessness
Ø Seeking
state and federal government support for key transport and infrastructure needs
Ø Responding
to increasing incidence of unauthorised building and development works
Ø Increase
market share for certification services
Ø Continue
to improve the efficiency of development assessment services
Ø Responding
to new planning system and related legislative changes
|
The key strategic objectives in Parramatta
Twenty25 ( Ø Businesses that are dynamic, prosperous
and socially responsible Ø A City that is innovative and
inspirational. |
To deliver these
objectives, Council will use partnerships, advocacy, projects and/or service
delivery to deliver the following strategies: Ø plan for and promote the clustering of
specific business and industry sectors in commercially appropriate locations Ø ensure that business is supported through
education, training and research Ø develop and promote Parramatta as THE
place to visit Ø encourage ethical businesses which act
responsibly towards the community and natural environment Ø fulfil Parramatta’s regional
responsibilities by providing high level cultural facilities to western
Sydney Ø develop a range of creative industries and
opportunities for artistic expression Ø provide an exciting and engaging range of
events and entertainment opportunities Ø develop Parramatta as a leading City for
research and development and technological innovation. Ø deliver profitable property and
development projects |
Council’s
services that are linked to the delivery of these objectives are:
|
Service
Area |
Included
in this service |
Purpose
(what we do) |
Key
Outputs (how we do it) |
Service
Outcome (why we do it) |
|
Development
and Traffic Services |
Development Assessment |
Ø Implement
state, regional and local planning policies. |
Ø Provide
advice to Council and stakeholders in all aspects of the DA process Ø Provide
pre-lodgement information Ø Assess
and determine DAs Ø Provide
support to Council in appeals. |
Ø Guide
and facilitate development. |
|
Planning Certificates |
Ø Provide
statutory information for property owners and purchasers |
Ø S149
(Planning Certificates) |
Ø Provide
accurate & timely property data |
|
|
Certification |
Ø Undertake
development certification services |
Ø Construction
Certificates Ø Occupation
Certificates |
Ø Development which complies with community
standards |
|
|
Traffic Facilities Management |
Ø To
promote road safety and awareness, and promote a more efficient traffic
network. |
Ø Traffic
infrastructure works to manage the safety, speed and efficiency of traffic.
Administration of Parramatta Traffic Committee and Traffic Engineers Advisory
Committee. |
Ø Safer, more efficient road network in
Parramatta. |
|
|
City
Strategy & Place Services |
City Strategy Place Services Transport Planning |
Ø Undertake
and integrate strategic research, analysis and planning across social,
environmental and economic areas Ø Co-ordinate
opportunities / risks affecting 2025 outcomes. Ø Corporate
planning and business improvement. Ø Review
and benchmark services across the organisation Ø Ensure
Council meets integrated/City Strategy planning requirements Ø Prepare
policies, strategies, promoting and lobbying for more sustainable transport. |
Ø Research
and analysis, strategic advice, initiate and develop innovative projects and
manage strategic partnerships. Ø Integrate
this activity across environmental, social, & economic areas, with a focus
on making it work in places Ø Provide
advice and analysis of Place based issues Ø Service
level agreements and Project briefs (with partners) Ø Simplified
business/service planning cycle, approach and support Ø Develop
and agree a methodology for services review Ø Initiate
the services review process Ø Engage
Leadership Team and Councillors in planning process Ø Policies,
strategies and plans relating to sustainable transport Ø Research
and lobby State and Federal governments. |
Ø To ensure Parramatta City Council is a leader in the industry. Ø To
provide comprehensive, timely and strategic information to decision makers Ø To
prepare the Council for the challenges of the future Ø To
foster innovation and creative problem solving Ø Integration of the “triple bottom line” into all
Council business (and to the benefit of the community). Ø Improve management of the business Ø Improvements in efficiency, cost effectiveness
or customer service of everything we do Ø Ensure Council is an industry leader. Ø Higher awareness of sustainable transport in
Parramatta and recognition of Parramatta’s transport needs in State
Government. |
|
Regulatory
Services |
Community Law and Education |
Ø Parking
patrols and program to provide vehicle turn over in CBD and public safety
& enforce legislation. |
Ø Parking
monitoring and enforcement through patrols and programs; school zones
and mobility parking Ø Monitor
animal control through registration, education and enforcement of legislation Ø Promote
and educate the public on local laws enforcement of public areas. |
Ø Provide
safe and orderly parking and enforcement that is fair and equitable Ø Promote
a safe community through enforce of local laws Ø To
protect the public and animal welfare by providing animal
registration and enforcement. |
|
Environmental Health & Protection |
Ø Enforce
and regulate relevant legislation relating to health, environment,
development, construction and fire safety. |
Ø Monitor
regulated premises through inspection programs. Ø Provide
education, advice and enforcement of Health, Environment,
Planning and related legislation. |
Ø To
promote public safety, health and environmental standards Ø To
protect and enhance the natural and built environment. |
|
|
Town Planning & Urban Design |
Land Use Planning &
S94 Management |
Ø Provide
land use planning service for Council. |
Ø Create
and amend LEPs, DCPs and other land use policy instruments Ø Consider
and process applications for rezoning Ø Administer
S94 and Heritage management and planning. |
Ø Control
and guide development in a manner that is sustainable and consistent with
both local and regional urban policy. |
|
Urban Design Services |
Ø Provide
advice and input into development assessment, public domain plans/works and
policy formulation relating to urban development. |
Ø Urban
design advice on significant DAs Ø Advice
and input to assist with the formulation of planning controls and guidelines Ø Administration
and monitoring of design competitions Ø Advice
and input into Council owned land development projects and guidelines. |
Ø Improvement
of the urban landscape. |
|
|
Property
Development |
Property Development |
Ø Develop
Council’s property portfolio |
Ø Development
of a property portfolio to deliver commercial returns. |
Ø Increase
PCC’s financial sustainability by increasing income, reducing costs and
ensuring the life cycle costing of assets are minimise while delivering the
best condition of asset possible. |
|
Civic Place Redevelopment |
Ø Deliver
Civic Place consistent with Master Plan and Project Development Agreement. Ø Successfully
change manage the move to Civic Place facilities. |
Ø Acquire
Darcy Street properties. Ø Manage
investment and property portfolio. Ø Design
and change manage the move Ø Integrate
workplace culture needs and service goals into our new Civic Place
environment. |
Ø New
community and Council facilities including public open space as well as
commercial, retails and residential space
Ø Stimulated
economic activity and improved social and environmental outcomes. Ø More
efficient services. |
|
|
Tourism
& Events |
Cultural Heritage & Visitor Information
(PHVIC) &Tourism Development |
Ø Promote
engagement with Parramatta's unique identity and its cultural heritage, both
historic and contemporary. Ø Develop
and promote Parramatta as a destination for visitors. |
Ø Providing
a range of heritage services and resources to various audiences. Ø Understanding
the visitor market and their needs, recognising and promoting opportunities
for enhanced visitor experiences. |
Ø Develop
awareness and understanding of Parramatta’s cultural heritage and identity. Ø Increase
visitor numbers to the city and enhance quality visitor experiences. |
|
Major Events |
Ø Provide a program of high quality, sustainable
major and community events. |
Ø Directly producing events, and
attracting events to Parramatta. |
Ø Position
Parramatta as a creative and dynamic destination. Ø Social, cultural and leisure benefits to
individuals and communities. |
Key
Actions for Council 2010-14
|
Service Area |
2010-11 |
2011-12 |
2012-13 |
2013-14 |
|
Development and Traffic Services |
Ø Technological enhancements. Introduction of on
line planning tool. Development controls / standards. Self assessment Ø Capability of planners to assess
applications for development in timely manner to encourage development and
coherent of targets. Skills assessment. Resource allocation. |
Ø Implement e-planning tools: -
enhance existing Track and Report -
establish Plan (requests for planning controls for properties) -
establish Assess (self assessment) -
on line lodgement of applications Ø Revise business practices/procedures arising from
technology enhancements. |
Ø Review implementation of e-planning tools and
explore further technology enhancements Ø Review impacts on technology on business
processes and resource allocation and training/skills of planners. Ø Respond to changes to planning legislation and
review operations of business unit. Ø Seek external Quality Assurance Accreditation of
business processes. |
Ø Review implementation of e-planning tools
and explore further technology enhancements Ø Review impacts on technology on business
processes and resource allocation and training/skills of planners. Ø Respond to changes to planning
legislation and review operations of business unit. |
|
City Strategy & Place
Services |
Ø Embed new reporting framework including year 1 of 4
year Delivery Program and Annual Report 2009-10 Ø Develop 2011-12 Operational Plan Ø Implement Service Review Ø Wireless City Ø Infuse TBL into core business Ø Implement the Environmental (Integrated Water)
Improvement Program Ø Review and update Council’s Biodiversity Plan Ø Develop Homelessness Policy and Implementation Plan Ø Implement Affordable Housing Actions – year 1 – 2 Ø Manage strategic health and housing partnerships and
projects Ø Undertake a series of activities to promote the city Ø Provide
strategic information to business community and analysis changes in economic
development – Biz Facts etc Ø Implement
Town and Neighbourhood Centre Improvements Ø Coordinate
planning for key city sites such as Horwood Place and Riverbank Ø Implement
City Infrastructure Program including upgrades to Church Street North
Parramatta Ø Reform
Places Services with an operational and strategic role |
Ø Develop
2012-13 Operational Plan Ø Plan
for review of Community Strategic Plan Ø Review
and update Council’s Climate Action Plan Ø Prepare
and implement the Parramatta Estuary Management Plan Ø Homelessness
Implementation Plan – year 1 Ø Implement
Affordable Housing Actions year 2 – 3 Ø Manage
strategic health and housing partnerships and projects Ø Undertake
a series of activities to promote the city Ø Develop
a business Tourism Strategy Ø Provide
strategic information to business community and analysis changes in economic
development – Biz Facts etc Ø Implement
Town and Neighbourhood Centre Improvements Ø Coordinate
planning for key city sites Ø Implement
City Infrastructure Program Ø Planning
relocation to Civic Place and Operations Centre Ø Imbed
process improvement changes |
Ø Review
Community Strategic Plan Ø Review
Delivery Program Ø Develop
2013-14 Operational Plan Ø Homelessness
Implementation Plan – year 2 Ø Implement
Affordable Housing Actions year 3 – 4 Ø Manage
strategic health and housing partnerships and projects Ø Undertake
a series of activities to promote the city Ø Implement
Town and Neighbourhood Centre Improvements Ø Coordinate
planning for key city sites Ø Implement
City Infrastructure Program Ø Planning
relocation to Civic Place and Operations Centre |
Ø Develop
2014-15 operational plan Ø Review
and update the Parramatta River Foreshore Plan Ø Review
and update Council’s Environmental Policy and Targets. Ø Homelessness
Implementation Plan – year 3 Ø Implement
Affordable Housing Actions year 4 – 5 Ø Manage
and Review strategic health and housing partnerships and projects Ø Undertake
a series of activities to promote the city Ø Implement
Town and Neighbourhood Centre Improvements Ø Coordinate
planning for key city sites Ø Implement
City Infrastructure Program Ø Relocation
to Civic Place and Operations Centre |
|
Regulatory Services |
Ø Increase food/regulated inspection program to
meet demands and food (agreement) act Ø Market and brand field staff and vehicles
fit for purpose. |
Ø Increase food/regulated inspection program to
meet demands and food (agreement) act. Ø Implement parking monitoring programs for all
areas and business centres Ø Provide a micro chipping animal service for
Parramatta residents Ø Review, trial and evaluate mobile
technology for use by field staff |
Ø Increase food/regulated inspection program to
meet demands and food (agreement) act. Ø Increase return rates of animals Ø Implement mobile technology for staff Ø Commence review of Enforcement Policies Ø Provide for on-line booking systems for
PCA |
Ø Increase food/regulated inspection program
to meet demands and food (agreement) act. Ø Increase return rates of animals Ø Review the operation of the parking Review
Panel |
|
Town Planning & Urban
Design |
Ø Develop public domain
guidelines Ø Joint study of Epping
planning controls with Hornsby Council Ø Review
design competition guidelines. Ø Prepare amended S94A
developer contributions plan. Ø Public
exhibition of new draft LEP & DCP |
Ø Complete review of heritage
list & prepare LEP amendment Ø Finalise LEP and commence consolidation
with city centre LEP & DCP, together with review of City Centre controls Ø Develop planning controls for the River
Road West/Rosehill precinct Ø Finalise Parramatta Public Domain
Guidelines for City Centre and local streets Ø Prepare and exhibit Westmead Precinct
Planning Strategy Ø Prepare urban design analysis and planning
controls for the auto alley precinct Ø Commence review of land acquisition
reservations Ø Develop project for designing City Centre
Public Domain Upgrades as per Civic Improvement Plan Ø Develop Lanes Activation Projects for City
Centre |
Ø Finalise LEP amendment in response to Heritage
Review Ø Finalise consolidation of City Centre LEP
& DCP and wider LEP & DCP Ø Develop Public Domain Guidelines for
Centres Ø Finalise Westmead LEP amendments Ø Finalise LEP/DCP Amendments for River Road
West/Rosehill Precinct Ø Finalise LEP amendments for review
of land acquisition reservations Ø Develop Parramatta Public Domain
Guidelines for City Centre Ø Commence house keeping amendments
relating to new LEP Ø Finalise project for Designing City Centre
Public Domain Upgrades Ø Develop Lanes Activation Projects for City
Centre |
Ø Review of Planning controls
for the Woodville Road precinct Ø Review and updates to LEP
& DCP |
|
Property Development |
Ø Develop versatile buildings Ø Continue the commercialisation of Council’s
redundant lands through the LEP process Ø Consolidate and develop sites. |
Ø Develop sites owned by Council Ø Develop versatile buildings Ø Design partner 2nd major project Ø Continue the commercialisation of Council’s
redundant lands through the LEP process Ø Consolidate and develop sites. |
Ø Develop versatile buildings Ø Develop hubs Ø Market hubs Ø Invest in high yield investments Ø Start 2nd major project and investigate 3rd major
project Ø Continue the commercialisation of Council’s
redundant lands through the LEP process Ø Consolidate and develop sites. |
Ø Start 3rd major project. |
|
Tourism & Events |
Ø Develop a festival of international
significance for Parramatta Ø Focus on marketing Parramatta as a centre
for innovation Ø Engage resources for tourism development
and management Ø Develop local tourism product Ø Develop a leisure brand for the City |
Ø Activate the river foreshore Ø Develop strategy to position Parramatta as
an events destination Ø Engage resources for tourism development
and management Ø Develop local tourism product Ø Develop a leisure brand for the City Ø Implement priority actions from the Visitation
Strategy |
Ø Engage resources for tourism development and management Ø Develop local tourism product Ø Develop a leisure brand for the City Ø Implement priority actions from the
Visitation Strategy Ø Attract major events to Parramatta |
Ø Develop Local Tourism Product Ø Implement priority actions from the
Visitation Strategy Ø Attract major events to Parramatta |
Key
performance measures
|
Resident
satisfaction measures |
Target |
Reporting
Frequency |
|
Percentage of resident satisfaction with
Parramatta Heritage and Visitor Information Centre |
60% satisfied or very satisfied |
Annual |
|
|
|
|
|
Other
measures |
Target |
Reporting
Frequency |
|
Number of events and exhibitions at the
Parramatta Heritage and Visitor Information Centre |
11 |
Annual |
|
Average level of attendance at the Parramatta
Heritage and Visitor Information Centre |
60,000 |
Annual |
|
Percentage of client satisfaction with the
Parramatta Heritage and Visitor Information Centre |
93% |
Annual |
|
Number of Parramatta City Centre businesses who
believe that |
60% |
Annual |
|
Mean time (net calendar days) for determination
of DAs |
40 |
Quarterly |
|
Median time (net calendar days) for determination
of DAs |
35 |
Quarterly |
|
Mean time (gross calendar days) for determination
of DAs |
60 |
Quarterly |
|
Median time (gross calendar days) for
determination of DAs |
55 |
Quarterly |
|
Percentage of DAs determined within 40 days (net
calendar days) |
75% |
Quarterly |
|
Percentage of food shops inspected |
100% |
Quarterly |
|
Percentage of micro chipped animals returned to
their owners |
65% |
Quarterly |
Council’s
services that focus on Governance and Corporate work to:
Ø Maintain the
highest level of good governance, teamwork, probity, openness, accountability,
timeliness and compliance with legislation
Ø Develop strategies which are
relevant to Council’s partners and the community and set priorities for
organisational focus and action
Ø Ensure Council services and
projects reflect the needs of our community and partners are implemented
according to adopted strategies
Ø Ensure Council finances and
assets are strategically planned and managed to secure Council’s long term
future
Ø Provide a “great place to work” where
Council values and behaviours are demonstrated and upheld by all Staff and
Councillors.
Key Challenges for the next 5 years:
Ø Future
Pathways - 2025 Integrated Planning,
Services Review continuous improvement
Ø Change Government - Open Government
Ø Technology
Ø Financial Sustainability
Ø Changing workforce
Ø Industry Leader - Best
Practice
Ø Population Need - Customer
Service
Ø Building leadership
capability to deliver at all levels
Ø Cultural change
Ø Implementing IT solutions
which minimise the need for HR operations and advice.
Ø New Operations Centre
Ø Strategic Management of
assets to ensure acceptable service standards
|
The key strategic
objectives are: Ø An
organisation that plans its future, improves systems and
processes, measures its success and compares its performance to others Ø Responsive
and best practice management of Council’s finances, risk, procurement and
assets Ø Build
a high performance culture and Become an Employer of Choice Ø A
well governed and led organisation that is service and community focussed and
communicates effectively. |
Strategies
to deliver these objectives include: Ø Stabilise
the business financially Ø Improve
technology to support business effectiveness Ø Champion
innovation and continuous improvement Ø Demonstrate
leadership in sustainability (triple bottom line) Ø Improve
stakeholder relationship management Ø Embed
a customer service culture internally and externally Ø Introduce
a robust performance management system Ø Continue
leadership development at all levels Ø Simplify
ER/IR systems so managers can manage Ø Benchmark/market
test all services to ensure value for money is being achieved Ø Implement
HR Best Practice IT solutions Ø Implement
the Strategic Asset Management Plan. Ø Sound
governance process |
Council’s
services that are linked to the delivery of these objectives are:
|
Service
Area |
Included
in this service |
Purpose
(what we do) |
Key
Outputs (how we do it) |
Service
Outcome (why we do it) |
|
|
Corporate,
Governance & Councillor Services |
Executive Management |
Ø Provide
Executive Management functions in Council |
Ø Effective
leadership and management of the organisation |
Ø To
be a well governed and customer focussed organisation that provides
leadership within the community |
|
|
Governance, Quality & Corporate Performance |
Ø Provide
support to the organisation in developing & maintaining high
standards of corporate governance |
Ø Develop
and implement corporate governance policies, procedures, systems and
performance standards |
Ø To
ensure that Council meets high governance standards in its statutory
compliance, accountability, efficiency, transparency & responsiveness and
operates in an honest, ethical and equitable manner |
||
|
Ø Review
& manage the Council’s integrated planning and reporting processes |
Ø Develop
and monitor planning & reporting processes that meet organisational and
statutory requirements |
Ø To
achieve and be accountable for the best use of available resources in
delivering the services required by the community |
|||
|
Ø Manage
the development, implementation and ongoing effectiveness of Council’s
business improvement and quality
program |
Ø Develop
and implement a continuous business improvement and quality process |
Ø To
ensure that community and organisational services are delivered in the most
efficient & effective manner |
|||
|
Audit & Legal |
Ø Ensure
compliance with legislation and code of conduct around corruption prevention |
Ø Develop
a Corruption Resistance Plan |
|
||
|
Councillor Support |
Ø Support
Councillors to fulfil their roles and responsibilities Ø Manage
Councillor Support Functions. |
Ø Design
and implement an on-going development program for Councillors e.g.
investigate the applicability of Australian Institute of Company Directors
Courses for Councillors, Senior Staff and as a WESROC wide initiative |
|
||
|
Finance
Management |
Financial and Management Accounting,
Procurement, Rates, Insurance & Risk Management |
Ø Provision
of financial management, procurement, risk management and insurance
management services and advice. |
Ø Budgeting,
internal and external financial reporting, taxation compliance, investments
and loans management Ø Rates
management, accounts payable and
receivable Ø Procurement
including purchase order processing and tender management Ø Insurance
claims and policy management Ø Risk
management education, policy and practices. |
Ø To
provide the financial information and advice to support organisational
decision making Ø To
fulfil statutory financial reporting and tax requirements Ø To
ensure Council’s creditors are paid in an accurate and timely manner Ø To
ensure that revenue due to Council is collected in an accurate and timely
manner Ø To
procure goods and services that are suitable for purpose and at the best
possible price Ø To
minimise risk to Council by having adequate insurances and risk management
policies and practices in place. |
|
|
Ø More
effective budgeting and financial management processes |
Ø Simplify
and shorten the budget process Ø Introduce clear Finance measures in business planning (KPIs) Ø Simple
bottom line agreed |
|
|||
|
Ø Whole
of life costing and business risk analysis for all new business initiatives
and service changes |
Ø Establish
the guidelines and toolkit for whole of life costing and business risk Ø Implement a targeted education program for
managers Ø Audit
the effectiveness of whole of life costing and business risk guidelines and
processes |
|
|||
|
Ø Prepare
and implement a Long Term Financial Position Plan (LTFP) |
Ø Develop
a credible 10 year Financial baseline and success model Ø Implement
the LTFP Ø Connect
the LTFP to Strategic Asset Management Plan and Council’s Community Plan (2025) |
|
|||
|
Ø Develop
a risk management policy, procedures and assessment tools |
Ø Implement
risk management policy, including establishment of an Enterprise Risk
Management Committee |
|
|||
|
Ø Conduct
risk assessments organisation wide |
Ø Continue
to refine initial risk estimates for high level risks |
|
|||
|
Ø Risk
analysis results in all business plans and projects |
Ø Incorporate
a risk analysis section into all business and project plans. Provide training as required |
|
|||
|
Ø Review
and implement a Business Continuity Framework (BCF) |
Ø Review
existing documentation Ø Implement
process of bring existing documentation up to date in consultation with
business units. Ø Develop
a policy, procedural framework and guidelines for BCF (Develop training
package) |
|
|||
|
Ø Develop
a procurement plan and procedures |
Ø Develop
a procurement manual for Councillors to provide guidance on roles and
responsibilities Ø Improve
skill sets of those with procurement responsibilities |
|
|||
|
Ø Improved
contract management and performance |
Ø Develop
a contract register and expiry and review schedules Ø Continue
to improve the standard conditions of contract and contract management manual Ø Training
in contract management for key managers Ø Performance criteria built into all contracts Ø Monitor
contract performance (including spot audits) |
|
|||
|
Human
Resources Management |
Human resources and payroll |
Ø To
provide the HR strategies, policies and services and build the managerial
capability necessary to enable the PCC Delivery Plan |
Ø HR
Strategy 2012 which will deliver PCC goals (rolling two-year reviews) Ø Best
practice policies that managers understand and can action (move towards
Manager HR Tool Kit) Ø Efficient/effective
OHS claims management - premium reduction Ø Workplace
audits and injury prevention Ø L&D
solutions that meets cultural, technical and business needs Ø Enterprise
bargaining and award negotiations (simplify) Ø Performance
management framework including reward linkages Ø Cultural
change - embed Guiding Principles at all levels Ø Improved
Management capability to operate without HR operational advice Ø Reporting
systems and frameworks that meet audience needs |
Ø Safe
and healthy workplace - fair compensation to those injured Ø L&D
solutions that drive business outcomes Ø Growth
in leadership capability and succession Ø Attraction
and retention of the best people Ø Reduction
of HR cost Ø High
performance culture and EOC brand Ø To
ensure Council’s staff are paid in an accurate and timely manner |
|
|
Ø Review,
develop and Implement a new Strategic HR Plan for 2009-2017 |
Ø Develop
an agreed strategy that addresses Council’s emerging issues around skills
shortages Ø Research
and develop a simple workforce plan Ø Review
current plan and finalise new plan Ø Implement
Plan |
|
|||
|
Ø Complete
Council’s Enterprise Agreement |
Ø Scope
and agree the organisations needs Ø Implement
the project plan to deliver Collective Agreement Ø Development
of a new salary system Ø Implement
the Enterprise Agreement outcomes |
|
|||
|
Ø Develop
a corporate social responsibility framework for Council staff |
Ø Develop
a framework and plan for corporate social responsibility |
|
|||
|
Ø Develop
and support managers to provide effective leadership and management (refer to
2.2.2 revised Organisational Culture Program) |
Ø Scope
and deliver a foundation managers course for new managers Ø Develop
an appropriately tailored Parramanagers program for level 2, 3 and 4 managers
including a mentoring program |
|
|||
|
Ø Continue
to develop the leadership and management capability of the organisation |
Ø Evaluate
the Organisational Culture Program Ø Initiate
revised Organisational Culture Program Ø Continue to deliver the
Leadership Development Program |
|
|||
|
Information
Communication & Technology |
Information Technology and Geographic
Information Systems |
Ø Provide
IT and GIS services to Council. |
Ø Problem
resolution of IT issues Ø Provision
of GIS and IT support services Ø Aligning
and updating technologies to suit PCC business needs |
Ø To
ensure business continuity Ø To
assist in enhancing business services within PCC. |
|
|
Ø Increase
accessibility and availability of geo-spatial information |
Ø Geo-spatial
information system ( |
|
|||
|
Ø Target
technology investments to improve efficiency |
Ø Network Infrastructure and Security Review
findings to be implemented over two years: § Virtualise server farm § Migrate to MS Exchange § Renew PC contract § TRIM – Promotion of use and cooperative deployment with
Records section § Design and implementation of Microsoft SharePoint § InfoCouncil – Integration to TRIM and SharePoint § Integration of SharePoint with TRIM § Continued development of Help Desk Services and Service
Level Agreements § Upgrade of desktop hardware and renewal of leasing
agreements to reduce on-going costs § Preparation of Mid & Long Term technology strategies Ø Implement
replacement Council Online system Ø Implement
online: Service Request lodgement, job application, rates payment, &
property certificate requests Ø Review
and better integrate Council’s asset applications in order to
support both the Strategic Plan and the Strategic Asset Management Plan. |
|
|
||
|
Customer
Relations & Communication |
Customer contact centre,
research & consultation, website & business information services |
Ø Provide
information and service about Council by customers doing business with us and
solving their problems however they approach us – by mail, web, phone or in
person Ø Create
and maintain Parramatta City Council website and various project websites. Manage
Council's business records Ø Implement
Information Management ‘Roadmap’. |
Ø Advice,
referrals, products and services Ø Records
management Ø PCC
Website Ø Informed
decision making, data research (findings, analysis & reporting) Ø Prepare
Records Management Plan Ø Review
and enhance knowledge management across the organisation Ø Implement a more effective
and comprehensive Intranet Ø Develop
options for utilising Wi-Fi in Parramatta |
Ø Complete
satisfaction – first time, every time Ø Easy
& quick access to accurate records Ø Informed
decision making Ø Accurate,
easy to find information about Council services. |
|
|
|
Communications and Marketing |
Ø Improved
communication internally and externally Ø Inform
the community about Council events, services and programs Ø Ensure
consistent and high quality messaging and branding to promote Parramatta
Council and the City Ø Comply
with legislative reporting requirements |
Ø Improved
mechanism for effectively communicating with our internal and external stakeholders Ø Implement
the External Communication, Brand and Marketing Plan, including clarification
of roles and responsibilities Ø Produce
the Annual Report |
Ø Review
and redevelop Internal Communications Plan Ø Implement
the revised Internal Communications Plan Ø Develop
a branding blueprint for the city of Parramatta |
|
|
Strategic
Asset and Property Management |
Strategic Asset Management |
Ø Manage
Council’s assets strategically |
Ø Develop
a strategic asset management plan and policy |
Ø Continue
to develop Core Strategic Asset Management Plan Ø Complete
paper and Business Case |
|
|
Ø Investigate
and implement new models of community use of facilities. |
Ø Research
and complete draft policy. |
|
|
||
|
Ø Increase
environmental sustainability of Council’s assets. |
Ø Review
vision and planning for sustainability Ø Establish
regular monitoring and reporting program for resource use Ø Retrofit
assets to reduce use of resources Ø Implement
revised waste system across all assets Ø Engage
staff in reducing environmental footprint Ø Reduce car fleet kilometres travelled and fuel use Ø Establish
sustainability standards for all new Council developments. |
|
|
||
|
Ø Establish
systems to reduce environmental risk. |
Ø Plan
for climate change adaptation Ø Improve
erosion, spill control and clean-up controls and procedures Ø Involve
and train staff in environmental risk management. |
|
|
||
Key
Actions for Council 2010-14
|
Service Area |
2010-11 |
2011-12 |
2012-13 |
2013-14 |
|
Corporate, Governance &
Councillor Services |
Ø Development
and implement top 10 strategic priorities. Ø Review
& redevelop internal communications plan |
Ø Councillor
elections Ø Develop
and implement top 10 strategic priorities Ø Review
Code of Conduct Ø Implement
policy review program. |
Ø Develop
and implement top 10 strategic priorities Ø Implement
policy review program Ø Implement
revised IPR framework Ø Develop
Councillor induction program Ø Implement
Compliance Plan |
Ø Develop
and implement top 10 strategic priorities Ø Implement
policy review program Ø Implement
Compliance Plan |
|
Finance Management |
Ø Implement
long term financial plan and gap closing strategies Ø Budget
2011-12 Ø Monthly
reporting Ø Quarterly
Reviews Ø Rollout
of new financial IT systems. |
Ø Implement
long term financial plan and gap closing strategies Ø Budget
2012-13 Ø Monthly
reporting Ø Quarterly
Reviews Ø Further
development and value add from new IT systems Ø Implement
Service Review improvements Ø Implement
improvements to management reporting. |
Ø Review,
update and implement long term financial plan and gap closing strategies Ø Budget
2013-14 Ø Monthly
reporting Ø Quarterly
Reviews. |
Ø Review,
update and implement long term financial plan and gap closing strategies Ø Budget
2014-15 Ø Monthly
reporting Ø Quarterly
Reviews. |
|
Human Resources Management |
Ø Develop
2010-12 HR strategic plan Ø Restructure
HR service unit to deliver against plan Ø Rethink
current consultative arrangements - simply Ø First
stage of HR automation (SITSR) - plan for balance Ø Performance
management system across PCC Ø Embed
Guiding Principles at all levels Ø Start
systemic review of policies and processes (including candidates for
automation) Ø Benchmark
HR services across Sydney councils - alternate service delivery options Ø Build
managerial capability to operate with less HR operational support. |
Ø Develop
2011-13 HR Strategic Plan Ø Continue
leadership development (Good to Great) Ø Introduce
talent management and succession strategy - "future leaders" Ø Implement
more online learning solutions Ø New
service delivery models (e.g. L&D) and achieve service delivery economies
with other Sydney councils Ø Provide
more in-house training (e.g. Train the Trainer accreditation for technical
training) Ø Automate
more HR processes Ø Consolidate/improve
performance management - lift focus on poor performance/up or out Ø Run
employee engagement survey (designed in house) - simple, inexpensive and
effective Ø Reduce
cost of HR services (including ER/IR and level of operational advice). |
Ø Develop
2012-14 HR Strategic Plan Ø Introduce
first of "manager self service" modules for HR Services through
Chris21 - key processes won't involve HR at all Ø All HR
policies and processes online and highly rated by managers (HR Toolkit) Ø HR
business unit advisory roles become strategic rather than operational as
managerial capability grows Ø Performance
management system managed online/automated end to end Ø Automate
future employee engagement surveys Ø Reduce
cost of general HR services - redirect resources to L&D, strategic advice
and better systems. |
Ø Develop
2013-15 HR Strategic Plan Ø Ensure
full operational HR responsibility sits with line managers ("people
leaders") Ø Position
HR as providers of strategies, reliable systems, effective policies,
service delivery broker/manager Ø HR
retains role of leadership talent management/succession advisor -
"building future leaders" program Ø Full
automation of HR systems and processes - paperless - workflows - system
controls apply policies Ø Reduce
cost of HR services. |
|
Information Communication & Technology |
Ø Core IT
Systems Replacement Ø IT
platform change Ø Intranet
Phase 1 Ø Review
of IS and internal practices. |
Ø Data
Centre Disaster Recovery ability Ø Complete
server virtualisation Ø Replace/upgrade
ICT Data Centre network, servers and storage. Ø Improve
ICT Security governance Ø Implement
GIS online internally within Council Ø Intranet
Phase 2 Ø Core
ICT Systems continuous improvement Ø Implement
new Library system |
Ø Implement
Unified Communications Ø Implement
GIS online for general public Ø Provide
new ICT SLAs internal to Council Ø Desktop
upgrade rollout Ø Core
ICT systems continuous improvement Ø Optimising
Wide Area Network |
Ø Core
ICT systems continuous improvement Ø Optimising
backup solution Ø Application/Desktop
virtualisation Ø Online
Data Archiving initiatives |
|
Customer Relations &
Communication |
Ø Review of customer channel
and cost per service Ø Digital access to
information Plan Ø Knowledge / Information
Management by developing better search capability Ø Website redevelopment Ø Records management plan. Ø Change
Research & Consultation delivery model. |
Ø Improve customer service via
improved Knowledge Management practices Ø Enhance website content,
expand social media interaction and increase online service transactions Ø Implement new on-line
Community Voice consultation model Ø Implement
Records Business Plan Ø Develop
Customer Service Strategy Ø Review
and implement Media Policy Ø Implement
Ethnic Communications Plan |
Ø Finalise service delivery
and relocation planning for new Civic Place facilities Ø Implement Customer Service
Strategy Ø Introduce Customer Service
Kiosks and self service options. Ø Implement Social Media
Strategy Ø Implement phase 2 intranet
development Ø Review and implement a
records communication plan Ø Review Community Engagement
Policy |
Ø Embed
new service delivery models in new Council facilities |
|
Strategic
Asset and Property Management |
Ø Asset maintenance reflecting Strategic Asset Management Plan (SAMP) Ø Improve SAM systems and integrate |
Ø Asset maintenance reflecting SAMP Ø Improve SAM systems and integrate Ø Upgrade Dundas Community Centre Ø Review encroachments on Council Lands Ø Acquire and activate an integrated Property Management System to
manage Council's properties. |
Ø Asset maintenance
reflecting SAMP Ø Upgrade soccer fields
at Ø Purchase property
for open
space in Granville area Ø Review encroachments on Council
lands Ø Implement and integrate a
mobile data capture system for asset and property maintenance and replacement Ø Develop a strategic asset
management plan and policy with links to LTFP Ø Develop and implement Capital Works Framework and Prioritisation Methodology and implement new Property Asset Maintenance and Capital Program to increase asset usage Ø Develop and
implement Service Level Standards and Service Level Agreements Ø Establish sustainability
standards for all Council Buildings. |
Ø Ongoing asset
maintenance and capital replacement
to reflecting the SAMP Ø Purchase property
for open space in Guildford area Ø Review encroachments on Council
lands Ø Continue to manage the
upgrading program of Council's built assets |
Key
performance measures
|
Resident
satisfaction measures |
Target |
Reporting
Frequency |
|
Percentage of residents who believe Parramatta
City Council is well managed |
Improvement on prior result |
Annual |
|
Percentage of resident rating of the level of services according
to overall satisfaction |
Improvement of prior result |
Annual |
|
|
|
|
|
Other
measures |
Target |
Reporting
Frequency |
|
Percentage of customer service requests responded
to within agreed timeframe |
Improvement on prior result |
Quarterly |
|
Percentage of calls resolved at first point of
contact |
80% |
Quarterly |
|
Tonnes of carbon dioxide emitted by Council
vehicle fleet |
<2,160 |
Annual |
|
Kilolitres of water used by key Council
properties |
91,320 |
Annual |
|
Tonnes of carbon dioxide emitted by Council high
energy consuming buildings |
<4,100 |
Annual |
|
Operating result before capital income |
In line with Long Term Financial Plan |
Annual |
|
Capital expenditure on existing assets/annual
depreciation |
1:1 |
Annual |
|
Percentage debt service ratio |
<8% |
Annual |
|
Collection performance – outstanding rates,
charges and fees |
<4% |
Annual |
|
Employee Turnover |
Reduce |
Annual |
|
OHS Premium |
Reduce 10% |
Annual |
Council’s Operational Plan 2012-13
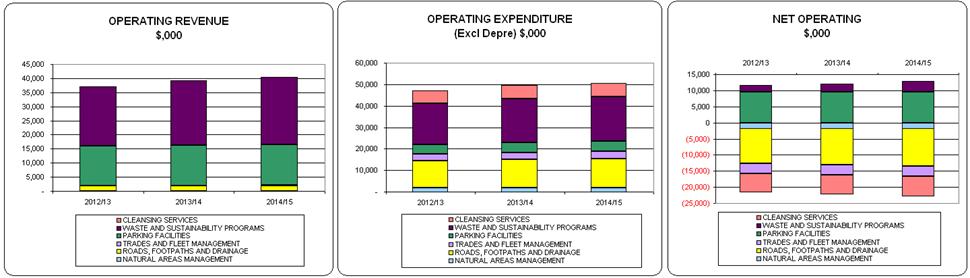
Financial Summary
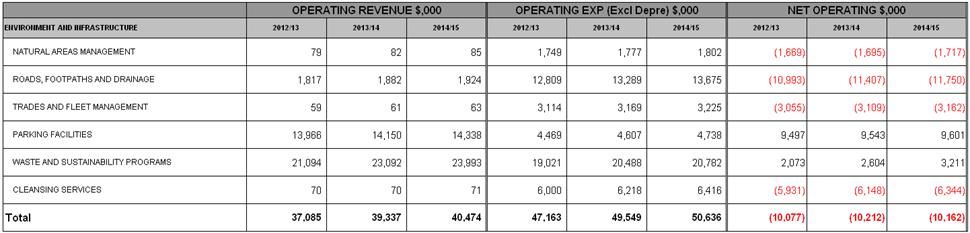
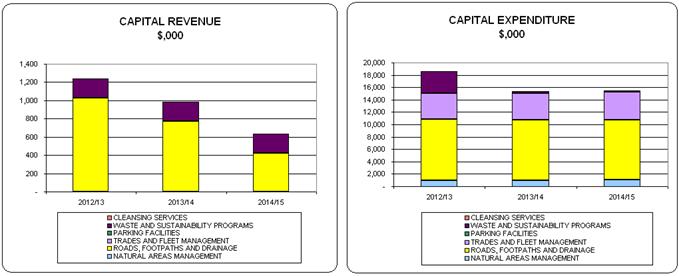
Financial Summary
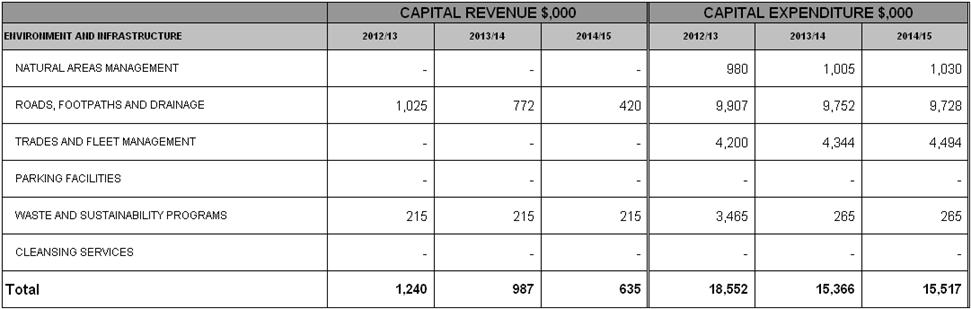
PROJECTS
|
(In $’000) |
2012/13 |
2013/14 |
2014/15 |
|
ENVIRONMENT AND INFRASTRUCTURE |
|
|
|
|
Capital Projects |
|
|
|
|
NATURAL AREAS MANAGEMENT |
|
|
|
|
Walking
Track Construction |
110 |
115 |
120 |
|
Restoration
of Natural Areas |
550 |
560 |
570 |
|
Waterways
Restoration |
320 |
330 |
340 |
|
ROADS, FOOTPATHS AND DRAINAGE |
|
|
|
|
Drainage
Improvements |
60 |
70 |
60 |
|
Street
Furniture |
100 |
100 |
100 |
|
Civil
Construction Program |
370 |
385 |
400 |
|
Flood
Mitigation Big 7 |
360 |
365 |
370 |
|
Kerb
& Gutter Repair & Maintenance |
1,000 |
1,000 |
1,100 |
|
Drainage
Construction Big 7 |
520 |
530 |
540 |
|
Roads
to Recovery |
372 |
360 |
- |
|
Pedestrian
Access Mobility Program |
1,200 |
1,250 |
1,350 |
|
Roads
Repair & Maintenance |
5,075 |
5,171 |
5,268 |
|
Fishladder
Construction |
300 |
- |
- |
|
Water
Quality Improvement Program |
300 |
300 |
300 |
|
Street
Lighting Upgrade Program |
120 |
85 |
95 |
|
Bridge
Assets - Safety Upgrades |
130 |
137 |
145 |
|
TRADES AND FLEET MANAGEMENT |
|
|
|
|
Light
Commercial Replacement |
743 |
765 |
788 |
|
Passenger
Vehicle Replacement |
2,546 |
2,622 |
2,701 |
|
Small
Plant Replacement |
56 |
59 |
62 |
|
Heavy
Plant Replacement |
855 |
898 |
943 |
|
WASTE AND SUSTAINABILITY PROGRAMS |
|
|
|
|
Sustainable
Water Program |
50 |
50 |
50 |
|
Waste
and Sustainability Improvement Program - Capital Works |
215 |
215 |
215 |
|
Paid
Parking |
3,200 |
- |
- |
|
|
|
|
|
|
Total For
Capital Projects |
18,552 |
15,366 |
15,517 |
|
|
|
|
|
|
Operating Projects |
|
|
|
|
NATURAL AREAS MANAGEMENT |
|
|
|
|
Bushland
Resources Management |
433 |
435 |
436 |
|
Asbestos
Removal |
53 |
54 |
55 |
|
Protection
of Aboriginal Heritage |
25 |
25 |
25 |
|
Waterways
Litter Reduction |
53 |
54 |
55 |
|
ROADS, FOOTPATHS AND DRAINAGE |
|
|
|
|
Catchment
Modelling Roads |
100 |
100 |
100 |
|
WASTE AND SUSTAINABILITY PROGRAMS |
|
|
|
|
Environment
Education Program |
20 |
20 |
20 |
|
Waste
and Sustainability Improvement Program - General Operating |
900 |
900 |
900 |
|
|
|
|
|
|
Total For
Operating Projects |
1,584 |
1,588 |
1,591 |
|
|
|
|
|
|
TOTAL FOR
ENVIRONMENT AND INFRASTRUCTURE |
20,137 |
16,954 |
17,108 |

Financial Summary
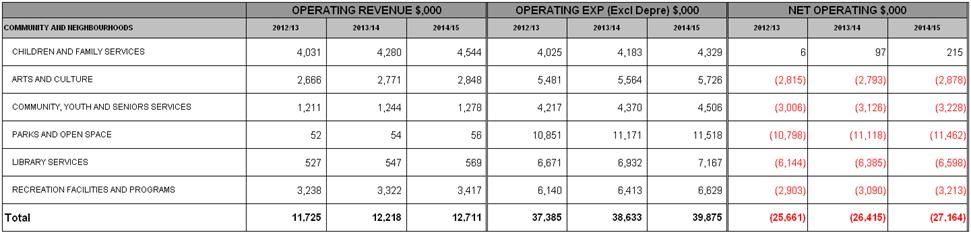
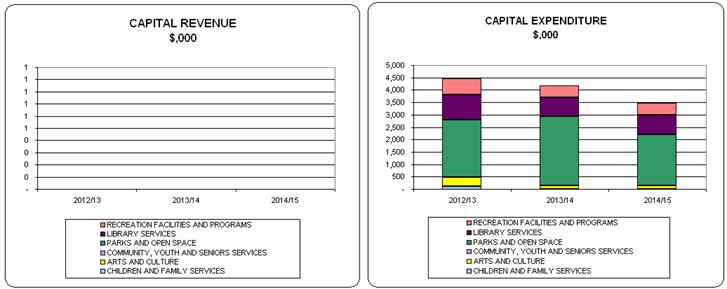
Financial Summary
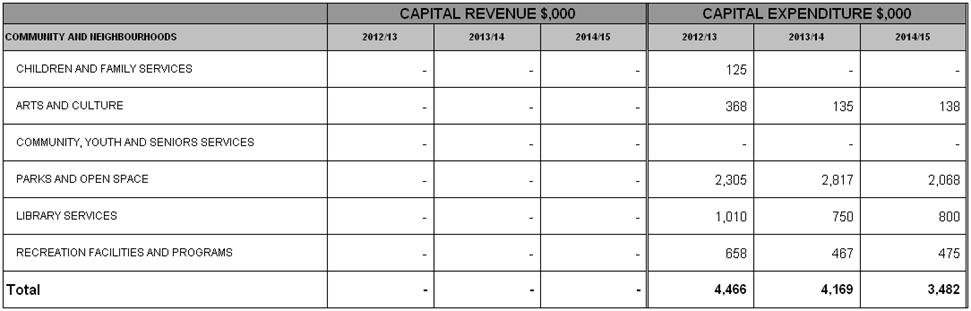
PROJECTS
|
(In $’000) |
2012/13 |
2013/14 |
2014/15 |
|
COMMUNITY AND NEIGHBOURHOODS |
|
|
|
|
|
Capital Projects |
|
|
|
|
|
CHILDREN AND FAMILY SERVICES |
|
|
|
|
|
Frances
Fisk Early Learning Centre Upgrade |
125 |
- |
- |
|
|
ARTS AND CULTURE |
|
|
|
|
|
Riverside
Plant & Equipment |
133 |
135 |
138 |
|
|
Riverside
Foyer Carpet |
70 |
- |
- |
|
|
|
65 |
- |
- |
|
|
|
100 |
- |
- |
|
|
PARKS AND OPEN SPACE |
|
|
|
|
|
Cultural
Parks Program |
85 |
87 |
88 |
|
|
Pavilion
Program |
595 |
490 |
490 |
|
|
Sportsground
Program |
500 |
440 |
440 |
|
|
Playground
Replacement |
430 |
440 |
450 |
|
|
Parks
Program |
370 |
380 |
390 |
|
|
City
of |
185 |
160 |
170 |
|
|
|
- |
480 |
- |
|
|
Biodiversity
Protection |
40 |
40 |
40 |
|
|
|
- |
100 |
- |
|
|
|
- |
200 |
- |
|
|
|
100 |
- |
- |
|
|
LIBRARY SERVICES |
|
|
|
|
|
Library
Resources |
750 |
750 |
800 |
|
|
Guildford
Branch Library Upgrade Fit-out |
260 |
- |
- |
|
|
RECREATION FACILITIES AND PROGRAMS |
|
|
|
|
|
Public
Halls & Community |
318 |
325 |
331 |
|
|
Recreation
Facilities |
37 |
38 |
39 |
|
|
Aquatic
Facilities Minor Capital Works |
53 |
54 |
55 |
|
|
Hambledon
Cottage Minor Capital |
50 |
50 |
50 |
|
|
Major
Capital Works Caroline Chisholm Tennis |
200 |
- |
- |
|
|
Total For
Capital Projects |
4,466 |
4,169 |
3,482 |
|
|
|
|
|
|
|
|
Operating Projects |
|
|
|
|
|
ARTS AND CULTURE |
|
|
|
|
|
Riverside
Theatres 25th Anniversary Celebration |
25 |
- |
- |
|
|
PARKS AND OPEN SPACE |
|
|
|
|
|
Wildlife
Surveys |
50 |
- |
- |
|
|
Total For
Operating Projects |
75 |
- |
- |
|
|
|
|
|
|
|
|
TOTAL FOR
COMMUNITY AND NEIGHBOURHOODS |
4,541 |
4,169 |
3,482 |
|
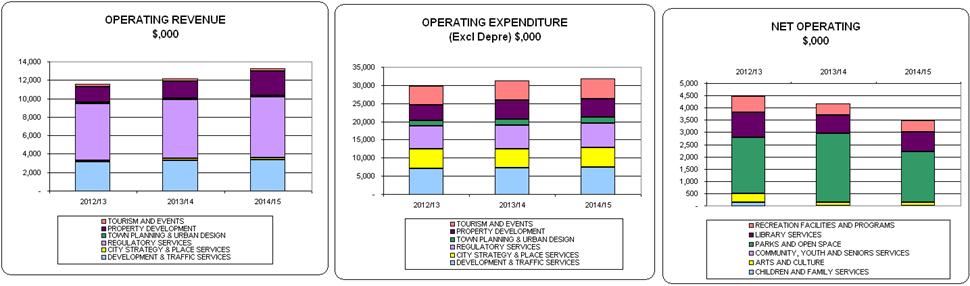
Financial Summary
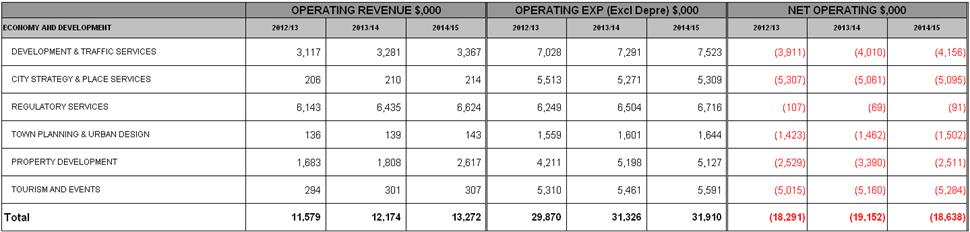
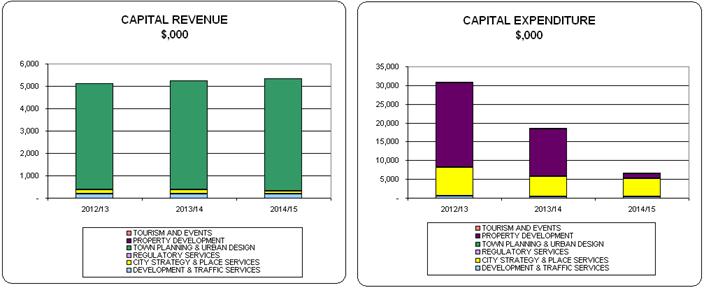
Financial Summary
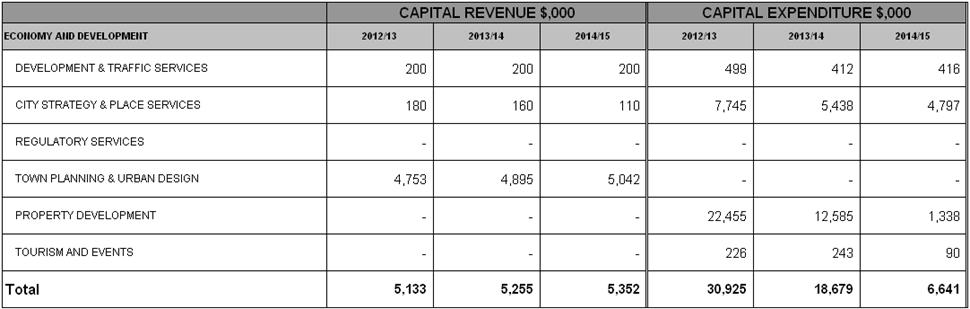
PROJECTS
|
(In $’000) |
2012/13 |
2013/14 |
2014/15 |
|
ECONOMY AND DEVELOPMENT |
|
|
|
|
Capital Projects |
|
|
|
|
DEVELOPMENT & TRAFFIC SERVICES |
|
|
|
|
Local
Traffic Facilities |
159 |
162 |
166 |
|
Auslink
Blackspot Program |
200 |
200 |
200 |
|
Rapid
Deployment CCTV Cameras |
100 |
50 |
50 |
|
Design
for the Intersection Granville |
40 |
- |
- |
|
CITY STRATEGY & PLACE SERVICES |
|
|
|
|
City
Centre Streetscape |
1,755 |
1,913 |
1,951 |
|
Neighbourhood
Improvement Program |
1,486 |
1,515 |
1,546 |
|
Local
Bike Facilities |
160 |
170 |
170 |
|
Foreshore
Improvement Plan |
35 |
40 |
30 |
|
Urgent
Works - Arthur Phillip |
402 |
100 |
100 |
|
Urgent
Works - Caroline Chisholm |
462 |
100 |
100 |
|
Urgent
Works - Elizabeth Macarthur |
412 |
100 |
100 |
|
Urgent
Works - Lachlan |
304 |
100 |
100 |
|
Urgent
Works - Woodville |
309 |
100 |
100 |
|
Cycle
Route Maintenance |
50 |
50 |
50 |
|
Contaminated
Lands - Investigation |
450 |
450 |
- |
|
|
100 |
100 |
- |
|
Greening
the CBD |
150 |
150 |
- |
|
Adaptation
to Extreme Weather |
100 |
50 |
50 |
|
Foreshore
Improvement |
500 |
- |
- |
|
Light
Rail Feasibility |
1,000 |
- |
- |
|
Improvements
to |
- |
500 |
500 |
|
City
Centre Cycle Routes |
70 |
- |
- |
|
PROPERTY DEVELOPMENT |
|
|
|
|
Civic
Place Project Management |
875 |
625 |
428 |
|
Strategic
Property Acquisition |
1,100 |
- |
- |
|
|
100 |
100 |
50 |
|
Operations
Centre |
19,520 |
10,760 |
60 |
|
|
300 |
300 |
100 |
|
|
- |
50 |
150 |
|
|
100 |
100 |
50 |
|
Property
Development (Specific Sites) |
310 |
650 |
500 |
|
|
150 |
- |
- |
|
TOURISM AND EVENTS |
|
|
|
|
|
76 |
88 |
90 |
|
Heritage
Centre Core Exhibition Renovation |
100 |
125 |
- |
|
Cultural
Collection and Archive Storage |
50 |
30 |
- |
|
Total For
Capital Projects |
30,925 |
18,679 |
6,641 |
|
|
|
|
|
|
Operating Projects |
|
|
|
|
CITY STRATEGY & PLACE SERVICES |
|
|
|
|
Economic
Development |
550 |
550 |
550 |
|
Waterways
Rehabilitation Masterplan |
50 |
50 |
50 |
|
Floodplain
Risk Management Roads |
120 |
120 |
120 |
|
Rydalmere
Technology Precinct |
85 |
- |
- |
|
Coordinator-Homelessness |
107 |
97 |
- |
|
Review
of Parra Twenty25 Community Strategic Plan |
50 |
- |
- |
|
Big
Ideas Implementation |
100 |
100 |
100 |
|
Place
Activation |
30 |
- |
- |
|
Engage
Strategy to Attract NSW Government to |
150 |
- |
- |
|
Crime
Prevention - LGA Wide Crime Prevention |
50 |
- |
- |
|
TOURISM AND EVENTS |
|
|
|
|
Parramasala |
300 |
300 |
300 |
|
Cultural
Heritage Collection Conservation and Asset Management |
10 |
10 |
- |
|
Total For
Operating Projects |
1,602 |
1,227 |
1,120 |
|
|
|
|
|
|
TOTAL FOR
ECONOMY AND DEVELOPMENT |
32,527 |
19,906 |
7,761 |
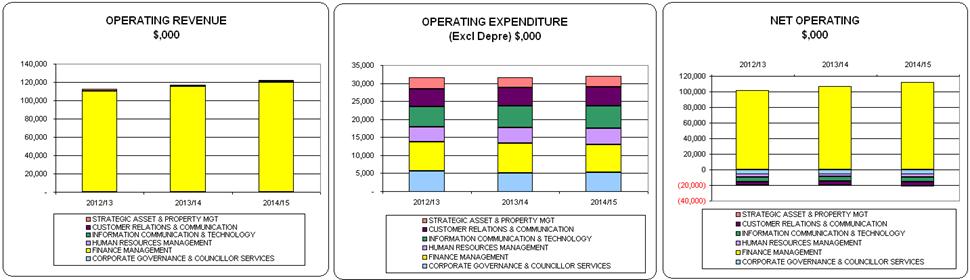
Financial Summary
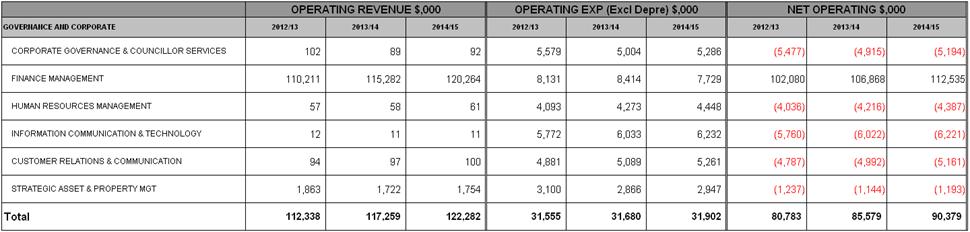
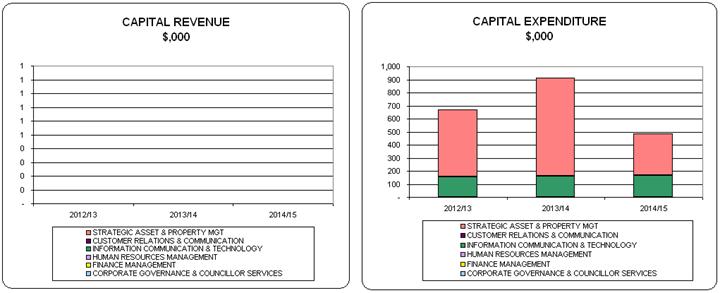
Financial Summary
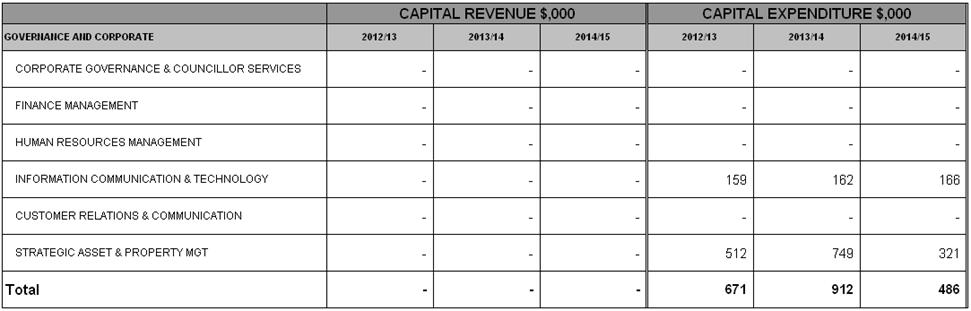
PROJECTS
|
(In $’000) |
2012/13 |
2013/14 |
2014/15 |
|
|
GOVERNANCE AND CORPORATE |
|
|
|
|
Capital Projects |
|
|
|
|
INFORMATION COMMUNICATION & TECHNOLOGY |
|
|
|
|
IT
Equipment Replacement Program |
159 |
162 |
166 |
|
STRATEGIC ASSET & PROPERTY MANAGEMENT |
|
|
|
|
Floodprone
Property Acquisition |
- |
433 |
- |
|
Libraries
& Child Care Facility |
212 |
216 |
221 |
|
Internal
Business Unit Relocations, Refurbishment |
100 |
100 |
100 |
|
Refurbishment
of |
200 |
- |
- |
|
|
|
|
|
|
Total For
Capital Projects |
671 |
912 |
486 |
|
|
|
|
|
|
Operating Projects |
|
|
|
|
INFORMATION COMMUNICATION & TECHNOLOGY |
|
|
|
|
IT
Business Improvement eParra |
57 |
58 |
60 |
|
STRATEGIC ASSET & PROPERTY MGT |
|
|
|
|
Fair
Value Assets and Condition Assessments |
140 |
140 |
140 |
|
|
|
|
|
|
Total For
Operating Projects |
197 |
198 |
200 |
|
|
|
|
|
|
TOTAL FOR
GOVERNANCE AND CORPORATE |
869 |
1,110 |
686 |
|
|
|
|
|
|
Grand Total |
58,073 |
42,139 |
29,038 |
FINANCIAL
MANAGEMENT FRAMEWORK
Financial Management Objectives
The primary objective of Council’s financial planning
is to ensure Council’s continued financial sustainability. A couple of years
ago, the analysis of Council’s financial situation and longer term financial
forecasts showed that there was an unsustainable gap between operating
expenditure and revenue that needed to be addressed. Not addressing this
operational deficit would ultimately jeopardise the adequate funding of capital
expenditure to maintain existing community assets and the additional
expenditure required to provide necessary infrastructure for the future
development of a rapidly growing City. In the past two years, as part of
implementing the integrated planning framework, Council developed a Long term
Financial Plan (LTFP) and Strategic Asset Management Plan (SAMP). As part of the current year’s budgeting
cycle, Council has reviewed and updated the LTFP to reflect material changes
that have eventuated since last year.
One of the key objectives of the LTFP was to achieve a
financially sustainable position by 2014/15 by rigorously reviewing the way it
delivers its services and ensuring that it derives optimum returns from revenue
opportunities, particularly the return on its property portfolio.
The objective for 2014/15 is to achieve a balanced
budget in terms of the operating result - excluding revenue from capital grants
and contributions. Operating income from rates, charges, fees, grants,
contributions and other revenue will be matching operating expenditure,
including interest on loans and depreciation. In addition to the annual operating result
Council needs to focus on some other key financial parameters. These include the prudent build up and use of
reserve funds (internally and externally restricted), liquidity and unrestricted
cash (reflected in a healthy working capital position), borrowings and debt
servicing, asset replacement and maintenance and new capital project
initiatives.
By focusing on these key areas and setting targets for
each of them over the period of the Delivery Program, Council aims to improve
the financial health of the organisation to a desirable level that can be
sustained in the long term.
To achieve this financial stability and sustainability
of the organisation for the long term, a number of related financial management
objectives have been adopted –
· Delivering
an operating surplus before capital income by 2014/15
· Achieving
a debt service ratio of under 8%
· Restricting
new loan borrowings and reducing debt levels
· Managing
the growth in employee costs
· Increasing
the proportion of non-rates revenue compared with total revenues
· Maintaining
and enhancing the existing asset base so that current service levels are not
compromised
· Undertaking
additional capital expenditure to support Parramatta’s position as Sydney’s
second CBD
The achievement of these
objectives will be facilitated by a number of key strategies:
ü Implementing
a new industrial relations framework
ü Comprehensive
review of all service areas both external and internal
ü IT
systems replacement
ü Property
strategy to optimise returns on Council’s portfolio
ü Rating
strategies
ü Proactive asset maintenance and replacement
ü Minimising deviations from budget targets
across the organisation
Details of how these strategies are included in
Council’s Long Term Financial Plan. The rating strategy is outlined in the next
section.
Key Financial Management Issues
Restrictions on revenue
Local Government is significantly restricted in its
capacity to raise increased revenue to fund community services. The primary source of revenue is rates and
annual charges. In 2012/13 Council will derive 62.6% of total operating revenue
from ordinary rates, special rates and annual charges. As noted above, IPART
determines the maximum amount by which rate revenue can increase and this has
been fixed at 3.6% for 2012/13. The average over the last 7 years was 3.2%.
In determining the 2012/13
rate peg, IPART has taken into consideration growth of 3.4% in the past year in
the Local Government Cost Index. IPART has subtracted a productivity adjustment
of 0.2% from the increase in the index and for this year only added a carbon
price advance of 0.4%, to determine a rate peg amount of 3.6%.
The fees and charges that Council determines for the
supply of goods and services have in most cases been increased by around 4% to
reflect increased costs associated with their supply. There are a number of
fees imposed by Council which are determined by State Government legislation.
In some cases these have not been increased for several years despite increases
to Council in the costs of providing the service.
Increasing costs of services
While Council’s revenue raising capacity is limited, it must face
increasing costs that in some areas are outstripping the income needed to fund
them. In 2012/13, employee costs account for 51% of total Council operating
expenditure excluding depreciation. In recent years employee costs had been growing by a rate that exceeded
the increase in revenues from rates, fees and charges. The continuation of this
trend would have been unsustainable. The growth in employee costs was
attributable to an increase in staff numbers as a result of implementing new
services and enhancing some existing services, the provisions of the salary and
wages system that was then operating together with the normal award increases
and significant increases in on-costs such as superannuation.
Action was taken in 2008 to impose a “freeze” on staff recruitment and
following a review of staffing requirements, 10 positions from the
establishment positions were removed averaging $1 million per annum in savings.
In addition, a new industrial relations framework was negotiated and in late
2010 a new salary and wages system was implemented. The new arrangements will
result in significant savings in employee costs of approximately $1M per annum.
Council’s current financial position, like all
Councils, has also been adversely impacted by cost shifting from other levels
of government. The Local Government and Shires Association regularly surveys
Councils on the impact of cost shifting and
Council’s financial position has also been affected by
the impact of a number of Government and utility charges that have increased at
a greater rate than Council’s revenues. Council’s
costs are also forecast to be impacted by the Carbon tax – particularly energy
costs and costs related to the disposal of waste. Council whilst reviewing its charges for
services such as domestic waste which are expected to be directly impacted by
the carbon tax has decided to have a phased approach to passing on the cost to
ratepayers.
Council has also provided a number of service
enhancements in recent years in response to the needs of a rapidly growing
City. These enhancements have covered a range of activities including extensive
development of the arts, tourism promotion, organisational development, improved
customer service and infrastructure maintenance. While some of those
enhancements have been partially funded by grant funds and new revenue from
parking meters, Council has nevertheless had to pick up a cost that is now part
of its core operations.
Debt levels and servicing
costs
Core Infrastructure Borrowings
In 1996 Council adopted a policy to restrict
new annual borrowings so as not to exceed the amount of principal to be repaid
in the same financial year. This had the effect of ensuring that the level of
debt did not increase. In 2000/01 the debt level under this policy was $29.3 million.
Since then Council did not take up its
allocated borrowing under this policy in some years, and the debt under this
policy in June 2013 is forecast to be $20.25M
One-off Borrowings for Major projects (Big
7)
In 2001/02 Council adopted a one-off strategy
to borrow an additional $15 million (in three instalments of $5 million over
three years) to fund major capital projects referred to as “The Big Seven”
major capital items. These loans are
being progressively repaid over a period of 15 years, and will be fully repaid
in 2017/18.
Civic Place Borrowings
Council also received two special loan
allocations totalling $55 million for strategic property acquisitions in
respect of the Civic Place Redevelopment Project – $35 million in the latter
part of the 2002/03 financial year and $20 million in 2003/04. These loans were
taken up on an interest – only basis, with the servicing costs being met by
income derived from leasing the properties purchased and interest income from
the unexpended loan portfolio. These loans were renewed in June 2008 on an
interest – only basis for a period of five years. However, the terms of the new
loans include the flexibility to make repayments or redraw on the $55 million
facility according to Council’s needs in relation to
As part of the 2011/12 budget, $6.2M has
been set aside for reducing the
In February 2012, there has been a
significant change to the
One-off Borrowings – Operations Centre
Council has plans to develop a new
Operations Centre which will replace its current Works Depot and centralise
some other Council functions from their existing locations. The new development
will be fully funded from the sale of existing properties but short term
borrowing of $10M million for up to 12 months will be required to allow the
project to proceed.
Subject to short term borrowing
requirements, Council has determined that it maintain a debt service ratio
(debt service costs/revenue from continuing operations excluding capital grants
& contributions) of less than 8%.
Projected new borrowings for each year and
outstanding debt levels at the end of each year are shown in the graph below:
Council proposes borrowing $13.43 million in
2012/13. In accordance with Council’s borrowing policy, $3.43 million will be
borrowed to fund Council’s infrastructure projects. A special borrowing of $10
million will be made to fund Council’s new Operations Centre which will replace the current Works Depot
and centralise some other Council functions from their existing locations. The
new development will be funded from the sale of existing properties but a short
term interim borrowing of $10M million will be required to allow the project to
proceed.
The provider of the 2012/13 loan program will be
determined by seeking quotations from major lending institutions in accordance
with Council’s borrowing policy. All loans are secured by way of mortgage over
Council’s Ordinary Revenue.
The following graph illustrates Council’s indebtedness and projections
of outstanding debt from 2012/13 to 2021/22 under the base scenario. Council aims for its debt service ratio to
remain below 8% however there are exceptions in the years when loan principals
are repaid on the
Local
Infrastructure Renewal Scheme (LIRS)
The NSW Government has recognised that investment in infrastructure is
needed across NSW, and as part of its NSW 2021 State Plan, the Government has
committed to increase expenditure on critical infrastructure.
To achieve this, among
other strategies, the NSW Government has committed to implementing a Local Infrastructure Renewal Scheme (LIRS) which aims to provide a
4% interest subsidy to assist those councils with legitimate infrastructure
backlogs to cover the cost of borrowing.
Councils' recently developed Strategic Asset
Management Plan (SAMP) reveals that
there is a significant gap between the actual expenditure on existing Council
infrastructure and buildings assets and the amount required to be spent to
maintain the existing service level for the community. This gap is around $6.5M/yr in capital
expenditure and $1M/yr in maintenance expenditure.
In this regard, Council's Long term
Financial Plan has provided for an additional $6M/yr on capital expenditure and
$1M/yr on maintenance expenditure from the 2015/16 year. The financial plan could not deliver this
funding requirement earlier than this date due to other competing priorities
around long term financial sustainability including achieving a net operating
surplus before capital revenue by 2014/15 which could be sustained in future
years and building a healthy level of reserve funds.
The
NSW Government’s LIRS provides the opportunity for Council’s to implement the
SAMP recommendations in a timely manner starting 2012/13 rather than in 2015/16
as currently planned due to funding constraints. It is proposed to borrow $20M in 3 annual instalments
of $6.5M, $6.5M and $7M respectively The interest subsidy would add up to
$4.85M over a 10 year period (in nominal terms).
As part of Council’s loan application, NSW
Treasury Corporation will conduct a financial assessment of Council. Following this exercise, Council will receive a comprehensive report from Treasury Corporation
which would focus on Council’s key financial risks and performance.
Council’s
application for loan funding under the LIRS is subject to approval by the
assessment panel. Therefore the planned
expenditure (capital expenditure and debt servicing) associated with this loan
borrowing is subject to the funding being made available. The financial statements of Council
incorporating impact of the LIRS borrowing are therefore included as a separate
scenario (titled Base plus LIRS borrowing) and would only eventuate if
Council’s LIRS application were to be successful.
Base Plus LIRS Borrowing Scenario
2012/13 BUDGET (Base Scenario)
Operating and Capital Budget 2012/13
Council has resolved to adopt a budget that delivers an operating deficit result before capital income of $1,778M. The tables and graphs below show a summary of the revenue and capital funding sources for the 2012/13 budget.
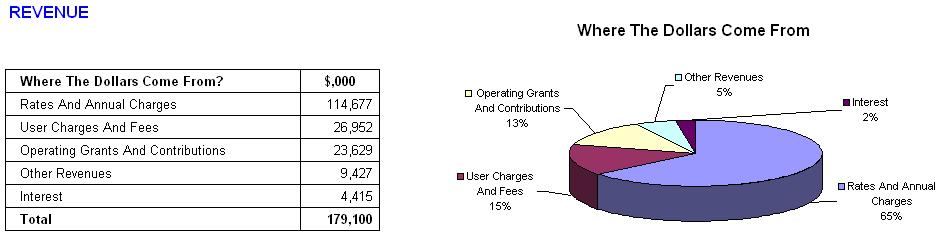
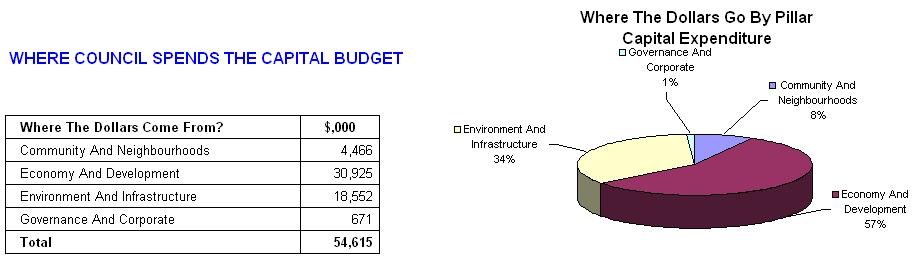


 Council plans to spend $58.1 million
on projects in 2012/13. This money pays for roads, footpaths, parks, sports
fields, nature reserves, waterways and refurbishing our neighbourhood centres
and the CBD. This budget includes projects planned for investment in the future
(Capital Projects, $54.6 million) and new operating initiatives (Operating
Projects, $3.5 million).
Council plans to spend $58.1 million
on projects in 2012/13. This money pays for roads, footpaths, parks, sports
fields, nature reserves, waterways and refurbishing our neighbourhood centres
and the CBD. This budget includes projects planned for investment in the future
(Capital Projects, $54.6 million) and new operating initiatives (Operating
Projects, $3.5 million).

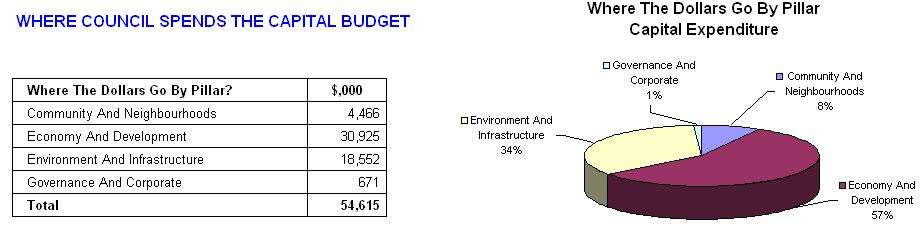


The
detailed Operating Statement showing a net operating result reconciliation to
the services result for the period 2012/13 to 2014/15 is shown on pages 75 to 77
of this document.
INCOME
AND EXPENSES ESTIMATES 2012/13 TO 2014/15
Council
has developed a 10 year long term financial plan to generate the following
estimates of income and expenses for 2012/13 to 2014/15. The Plan is available
as a separate document and includes forecasts extending to 2021/22.
The
forward estimates have as their base the 2012/13 Budget, with appropriate
assumptions where actual financial information is uncertain or not available.
The key assumptions for 2012/13 are shown below. The assumptions for the years
beyond 2012/13 are detailed in Council’s Long Term Financial Plan.
|
|
3.6% rate pegging confirmed. Additional special rate
variation of 0.7% included in estimates as approved by IPART. Growth of $400,000 |
|
User Charges and Fees |
4% in general, but some have been increased more to
reflect costs, statutory fees not changed |
|
Investment Interest Rate |
5% |
|
Annual Charges |
10% domestic waste management. No change to
stormwater management charge |
|
Grants and Contributions |
3% plus specific known additional grants financial
assistance grant 7% |
|
Section 94 Development Contributions |
3% |
|
Other Revenue |
3% |
|
Employee Expenses |
In line with salary system provisions and award
entitlements |
|
Materials and Contracts and Other Expenses |
3% |
Note:
Budget and Forward Estimates exclude any impact of asset sales
*** Following the adoption by Council of the
Draft Amended Delivery Program 2010/11 to 2013/14 and Draft Operational
Plan 2012/13, Council received
advice from the Department of Local Government in the form of an addendum
to the guidelines for special variation to rates, that IPART in relation to the
Carbon Price Advance (to reflect equitable treatment to all councils) have
now made a decision to allow Council to apply for modifications to Council’s previously approved special variation
percentages by:
· Allowing an additional variation of 0.4% in
2012/13, and
· Reducing the approved
variation in 2013/14 by 0.1%
The tables
and statements included in this document do not reflect the impact of this amendment, as it is subject to IPART
review and approval in June 2012.
Operating
result comparison against previous alternatives (Base Scenario)

Operating
Statement (Base Scenario)
|
Description ($000) |
2012/13 |
2013/14 |
2014/15 |
|
|
|
|
|
|
REVENUE |
|
|
|
|
RATES
AND ANNUAL CHARGES |
108,172 |
114,307 |
119,200 |
|
SPECIAL
RATES |
6,505 |
6,784 |
7,076 |
|
USER
CHARGES AND FEES |
26,952 |
27,642 |
28,287 |
|
INTEREST |
4,415 |
4,415 |
4,415 |
|
OTHER
REVENUES |
9,427 |
9,699 |
10,721 |
|
GRANTS
– SERVICES |
13,060 |
13,834 |
14,622 |
|
CONTRIBUTIONS
& DONATIONS – SERVICES |
3,196 |
3,305 |
3,417 |
|
GRANTS
- MP PROJECTS - (Operating) |
980 |
980 |
980 |
|
CONTRIBUTIONS & DONATIONS - MP PROJECTS
(Operating) |
20 |
20 |
20 |
|
TOTAL OPERATING REVENUE |
172,727 |
180,987 |
188,739 |
|
GRANTS
- MP PROJECTS - (Capital) |
1,608 |
1,333 |
931 |
|
CAPITAL
CONTRIBUTIONS AND DONATIONS |
4,766 |
4,909 |
5,056 |
|
TOTAL CAPITAL REVENUE |
6,373 |
6,242 |
5.987 |
|
TOTAL REVENUE |
179,100 |
187,229 |
194,726 |
Operating Statement (Base Scenario) cont’d
|
Description
($000) |
2012/13 |
2013/14 |
2014/15 |
|
|
|
|
|
|
EXPENSES |
|
|
|
|
EMPLOYEE COSTS |
75,140 |
77,900 |
80,614 |
|
BORROWING COSTS |
4,580 |
5,081 |
4,939 |
|
MATERIALS & CONTRACTS |
30,687 |
31,340 |
32,244 |
|
OTHER OPERATING EXPENSES |
32,107 |
33,853 |
33,617 |
|
TOTAL SERVICES EXPENSES |
142,515 |
148,174 |
151,414 |
|
OPERATING PROJECTS |
3,459 |
3,013 |
2,911 |
|
DEPRECIATION |
28,532 |
29,976 |
33,064 |
|
TOTAL OPERATING EXPENSES |
174,505 |
181,164 |
187,388 |
|
|
|
|
|
|
NET OPERATING RESULT |
4,595 |
6,066 |
7,338 |
|
|
|
|
|
|
OPERATING RESULT BEFORE
CAPITAL REVENUE |
(1,778) |
(176) |
1,351 |
|
|
|
|
|
|
CAPITAL PROJECTS – EXPENDITURE |
54,615 |
39,126 |
26,127 |
|
CAPITAL PROJECTS FUNDING FROM
RESERVES |
54,615 |
39,126 |
26,127 |
|
NET CAPITAL PROJECTS RESULT |
0 |
0 |
0 |
Reconciliation of Net Operating Result to Services
Result (Base Scenario)
|
Description ($000) |
2012/13 |
2013/14 |
2014/15 |
|
SURPLUS/(DEFICIT)
FROM CONTINUING OPERATIONS |
4,595 |
6,066 |
7,338 |
|
PLUS
DEPRECIATION |
28,532 |
29,976 |
33,064 |
|
PLUS
OPERATING PROJECTS |
3,459 |
3,013 |
2,911 |
|
LESS
RESTRICTED REVENUE |
13,878 |
14,026 |
14,063 |
|
LESS LOAN
PRINCIPAL PAYMENTS |
17,105 |
6,036 |
5,955 |
|
LESS TRANSFER
TO RESERVE |
16,869 |
17,021 |
22,323 |
|
PLUS TRANSFER
FROM RESERVE TO FUND SERVICES |
20,304 |
7,864 |
10,302 |
|
SERVICES
RESULT |
9,038 |
9,836 |
11,274 |
BALANCE SHEET (Base Scenario)
|
Balance
Sheet Description (in $000) |
2012/13 |
2013/14 |
2014/15 |
|
ASSETS |
|
|
|
|
Current
assets |
|
|
|
|
Cash and cash equivalents |
$6,000 |
$6,000 |
$6,000 |
|
Investments |
$60,580 |
$58,759 |
$73,941 |
|
Receivables |
$13,043 |
$13,043 |
$13,043 |
|
Inventories |
$141 |
$141 |
$141 |
|
Other |
$500 |
$500 |
$500 |
|
Non-current assets classified as held for
resale |
$0 |
$0 |
$0 |
|
Total
current assets |
$80,264 |
$78,443 |
$93,625 |
|
|
|
|
|
|
Non-current
assets |
|
|
|
|
Receivables |
$527 |
$527 |
$527 |
|
Investments |
$27,500 |
$27,500 |
$27,500 |
|
Infrastructure property, plant &
equipment |
$3,603,339 |
$3,609,698 |
$3,600,145 |
|
Intangible assets |
$4,288 |
$3,471 |
$2,655 |
|
Investments accounted for using equity
method |
$2,754 |
$2,754 |
$2,754 |
|
Total
non-current assets |
$3,638,408 |
$3,643,950 |
$3,633,581 |
|
|
|
|
|
|
Total
assets |
$3,718,672 |
$3,722,393 |
$3,727,206 |
|
|
|
|
|
|
LIABILITIES |
|
|
|
|
Current
liabilities |
|
|
|
|
Payables |
$14,500 |
$14,500 |
$14,500 |
|
Interest bearing liabilities |
$6,036 |
$5,955 |
$6,107 |
|
Provisions |
$21,121 |
$21,928 |
$22,767 |
|
Total
current liabilities |
$41,656 |
$42,383 |
$43,374 |
|
|
|
|
|
|
Non-current
liabilities |
|
|
|
|
Interest bearing liabilities |
$69,603 |
$66,493 |
$62,935 |
|
Provisions |
$1,003 |
$1,043 |
$1,084 |
|
Total
non-current liabilities |
$70,606 |
$67,536 |
$64,019 |
|
|
|
|
|
|
Total
liabilities |
$112,262 |
$109,918 |
$107,393 |
|
|
|
|
|
|
Net
assets |
$3,606,410 |
$3,612,475 |
$3,619,813 |
|
|
|
|
|
|
EQUITY |
|
|
|
|
Retained earnings |
$883,523 |
$889,588 |
$896,926 |
|
Reserves |
$2,722,887 |
$2,722,887 |
$2,722,887 |
|
Total
equity |
$3,606,410 |
$3,612,475 |
$3,619,813 |
CASH FLOW STATEMENT (Base
Scenario)
|
Budget Cash Flow Statement (in $'000) |
2012/13 |
2013/14 |
2014/15 |
|
Cash flows from operating activities |
|
|
|
|
Receipts: |
|
|
|
|
Rates and annual charges |
114,677 |
121,091 |
126,277 |
|
User charges and fees |
26,952 |
27,642 |
28,287 |
|
Investment revenue and interest |
4,415 |
4,415 |
4,415 |
|
Grants and contributions |
23,630 |
24,381 |
25,026 |
|
Other |
9,427 |
9,699 |
10,721 |
|
Payments: |
|
|
|
|
Employee benefits and on-costs |
(74,326) |
(77,053) |
(79,733) |
|
Materials and contracts |
(32,417) |
(32,847) |
(33,699) |
|
Borrowing costs |
(4,580) |
(5,081) |
(4,939) |
|
Other |
(33,837) |
(35,360) |
(35,073) |
|
Net cash provided (or used in) operating activities |
33,942 |
36,888 |
41,283 |
|
|
|
|
|
|
Cash flows from investing activities |
|
|
|
|
Receipts: |
|
|
|
|
|
0 |
1,821 |
0 |
|
|
43,000 |
1,745 |
1,530 |
|
|
1,824 |
1,863 |
1,902 |
|
Payments: |
|
|
|
|
Purchase of investments |
(20,541) |
0 |
(15,182) |
|
Purchase of real estate |
|
|
|
|
Purchase of infrastructure, property,
plant and equipment |
(54,615) |
(39,126) |
(26,127) |
|
Net cash provided by (or used in) investing activities |
(30,332) |
(33,697) |
(37,877) |
|
|
|
|
|
|
Cash flows from financing activities |
|
|
|
|
Receipts: |
|
|
|
|
Borrowings and advances |
13,495 |
2,845 |
2,549 |
|
Payments: |
|
|
|
|
Borrowings and advances |
(17,105) |
(6,036) |
(5,955) |
|
Net cash provided by (or used in) financing activities |
(3,610) |
(3,191) |
(3,406) |
|
|
|
|
|
|
Net increase/(decrease) in cash and cash equivalents |
0 |
0 |
0 |
|
Cash and cash equivalents at beginning of reporting period |
6,000 |
6,000 |
6,000 |
|
Cash and cash equivalents at end of reporting period |
6,000 |
6,000 |
6,000 |
|
** Increase/Decrease |
0 |
0 |
0 |
RESERVES SUMMARY (Base Scenario)
|
Transfers to and From Reserves (in $'000) |
2012/13 |
2013/14 |
2014/15 |
|
|
|
|
|
|
External Reserves |
|
|
|
|
|
|
|
|
|
Loans |
|
|
|
|
Opening
Balance |
$444 |
$477 |
$521 |
|
Plus
Transfers to Reserve |
$13,495 |
$2,845 |
$2,549 |
|
Less
Transfers from Reserve |
($13,462) |
($2,801) |
($2,502) |
|
Closing
Balance |
$477 |
$521 |
$568 |
|
|
|
|
|
|
Grants and Contributions |
|
|
|
|
Opening
Balance |
$1,645 |
$1,798 |
$1,811 |
|
Plus
Transfers to Reserve |
$3,309 |
$3,069 |
$2,705 |
|
Less
Transfers from Reserve |
($3,156) |
($3,056) |
($2,691) |
|
Closing
Balance |
$1,798 |
$1,811 |
$1,825 |
|
|
|
|
|
|
Section 94 Contributions |
|
|
|
|
Opening
Balance |
$22,341 |
$24,651 |
$28,280 |
|
Plus
Transfers to Reserve |
$5,994 |
$6,186 |
$6,385 |
|
Less
Transfers from Reserve |
($3,684) |
($2,557) |
($2,475) |
|
Closing
Balance |
$24,651 |
$28,280 |
$32,190 |
|
|
|
|
|
|
Domestic Waste |
|
|
|
|
Opening
Balance |
$4,220 |
$3,919 |
$4,011 |
|
Plus
Transfers to Reserve |
$1,899 |
$2,392 |
$2,959 |
|
Less
Transfers from Reserve |
($2,200) |
($2,300) |
($2,400) |
|
Closing
Balance |
$3,919 |
$4,011 |
$4,570 |
|
|
|
|
|
|
Open Space Special Rate |
|
|
|
|
Opening
Balance |
$786 |
$473 |
$93 |
|
Plus
Transfers to Reserve |
$2,248 |
$2,345 |
$2,446 |
|
Less
Transfers from Reserve |
($2,561) |
($2,725) |
($1,769) |
|
Closing
Balance |
$473 |
$93 |
$770 |
|
|
|
|
|
|
Suburban Infrastructure Special Rate |
|
|
|
|
Opening
Balance |
$1,025 |
$1,034 |
$1,434 |
|
Plus
Transfers to Reserve |
$1,750 |
$1,824 |
$1,903 |
|
Less
Transfers from Reserve |
($1,741) |
($1,424) |
($1,406) |
|
Closing
Balance |
$1,034 |
$1,434 |
$1,931 |
|
|
|
|
|
|
CBD Infrastructure Special Rate |
|
|
|
|
Opening
Balance |
$4,510 |
$4,712 |
$4,700 |
|
Plus
Transfers to Reserve |
$2,223 |
$2,317 |
$2,416 |
|
Less
Transfers from Reserve |
($2,021) |
($2,329) |
($1,951) |
|
Closing
Balance |
$4,712 |
$4,700 |
$5,165 |
|
|
|
|
|
|
Economic Development Special Rate |
|
|
|
|
Opening
Balance |
$259 |
$252 |
$333 |
|
Plus
Transfers to Reserve |
$692 |
$722 |
$753 |
|
Less
Transfers from Reserve |
($699) |
($641) |
($644) |
|
Closing
Balance |
$252 |
$333 |
$442 |
|
|
|
|
|
|
Stormwater Levy |
|
|
|
|
Opening
Balance |
$392 |
$404 |
$365 |
|
Plus
Transfers to Reserve |
$1,382 |
$1,431 |
$1,481 |
|
Less
Transfers from Reserve |
($1,370) |
($1,470) |
($1,470) |
|
Closing
Balance |
$404 |
$365 |
$376 |
|
Total External
Reserves |
$37,720 |
$41,548 |
$47,837 |
|
Internal Reserves |
|
|
|
|
|
|
|
|
|
Plant Replacement |
|
|
|
|
Opening
Balance |
$1,994 |
$2,093 |
$2,185 |
|
Plus
Transfers to Reserve |
$4,299 |
$4,436 |
$4,578 |
|
Less
Transfers from Reserve |
($4,200) |
($4,344) |
($4,494) |
|
Closing
Balance |
$2,093 |
$2,185 |
$2,269 |
|
|
|
|
|
|
Employee Leave Entitlements |
|
|
|
|
Opening
Balance |
$1,490 |
$2,418 |
$2,418 |
|
Plus
Transfers to Reserve |
$928 |
$0 |
$1,581 |
|
Less
Transfers from Reserve |
$0 |
$0 |
$0 |
|
Closing
Balance |
$2,418 |
$2,418 |
$3,999 |
|
|
|
|
|
|
Property |
|
|
|
|
Opening
Balance |
$1,015 |
$1,217 |
$1,419 |
|
Plus
Transfers to Reserve |
$202 |
$202 |
$266 |
|
Less
Transfers from Reserve |
$0 |
$0 |
$0 |
|
Closing
Balance |
$1,217 |
$1,419 |
$1,685 |
|
|
|
|
|
|
Property Development and Investment |
|
|
|
|
Opening
Balance |
$7,521 |
$29,644 |
$18,824 |
|
Plus
Transfers to Reserve |
$43,000 |
$1,745 |
$1,530 |
|
Less
Transfers from Reserve |
($20,877) |
($12,565) |
($1,539) |
|
Closing
Balance |
$29,644 |
$18,824 |
$18,815 |
|
|
|
|
|
|
Civic Place Redevelopment |
|
|
|
|
Opening
Balance |
$451 |
$51 |
$51 |
|
Plus
Transfers to Reserve |
$0 |
$0 |
$0 |
|
Less
Transfers from Reserve |
($400) |
$0 |
$0 |
|
Closing
Balance |
$51 |
$51 |
$51 |
|
|
|
|
|
|
Computer |
|
|
|
|
Opening
Balance |
$373 |
$373 |
$373 |
|
Plus
Transfers to Reserve |
$928 |
$1,401 |
$3,638 |
|
Less
Transfers from Reserve |
($928) |
($1,401) |
($3,638) |
|
Closing
Balance |
$373 |
$373 |
$373 |
|
|
|
|
|
|
Insurance |
|
|
|
|
Opening
Balance |
$527 |
$527 |
$527 |
|
Plus
Transfers to Reserve |
$0 |
$0 |
$500 |
|
Less
Transfers from Reserve |
$0 |
$0 |
$0 |
|
Closing
Balance |
$527 |
$527 |
$1,027 |
|
|
|
|
|
|
Open Space |
|
|
|
|
Opening
Balance |
$429 |
$504 |
$582 |
|
Plus
Transfers to Reserve |
$75 |
$78 |
$81 |
|
Less
Transfers from Reserve |
$0 |
$0 |
$0 |
|
Closing
Balance |
$504 |
$582 |
$663 |
|
|
|
|
|
|
Council Election |
|
|
|
|
Opening
Balance |
$462 |
$3 |
$149 |
|
Plus
Transfers to Reserve |
$141 |
$146 |
$152 |
|
Less
Transfers from Reserve |
($600) |
$0 |
$0 |
|
Closing
Balance |
$3 |
$149 |
$301 |
|
|
|
|
|
|
Parking Meters |
|
|
|
|
Opening
Balance |
$3,497 |
$1,142 |
$1,920 |
|
Plus
Transfers to Reserve |
$3,483 |
$3,438 |
$3,399 |
|
Less
Transfers from Reserve |
($5,838) |
($2,660) |
($2,792) |
|
Closing
Balance |
$1,142 |
$1,920 |
$2,527 |
|
|
|
|
|
|
Prior Year Revenue |
|
|
|
|
Opening
Balance |
$4,550 |
$490 |
$490 |
|
Plus
Transfers to Reserve |
$0 |
$0 |
$0 |
|
Less
Transfers from Reserve |
($4,060) |
$0 |
$0 |
|
Closing
Balance |
$490 |
$490 |
$490 |
|
|
|
|
|
|
Asset Renewal |
|
|
|
|
Opening
Balance |
$3,596 |
$6,466 |
$7,829 |
|
Plus
Transfers to Reserve |
$3,000 |
$1,500 |
$1,500 |
|
Less
Transfers from Reserve |
($130) |
($137) |
($145) |
|
Closing
Balance |
$6,466 |
$7,829 |
$9,184 |
|
|
|
|
|
|
Other Reserves |
|
|
|
|
Opening
Balance |
$3,744 |
$2,332 |
$3,709 |
|
Plus
Transfers to Reserve |
$0 |
$1,401 |
$1,525 |
|
Less
Transfers from Reserve |
($1,412) |
($24) |
($24) |
|
Closing
Balance |
$2,332 |
$3,709 |
$5,210 |
|
Total Internal
Reserves |
$47,260 |
$40,476 |
$46,594 |
|
|
|
|
|
|
Total
External Reserves |
$37,720 |
$41,548 |
$47,837 |
|
Total
Internal Reserves |
$47,260 |
$40,476 |
$46,594 |
|
Total
Reserves |
$84,980 |
$82,024 |
$94,431 |
Operating
result comparison against previous alternatives (Base Plus LIRS Borrowing
Scenario)
Operating
Statement (Base + LRIS Borrowing Scenario)
|
Description ($000) |
2012/13 |
2013/14 |
2014/15 |
|
|
|
|
|
|
REVENUE |
|
|
|
|
RATES
AND ANNUAL CHARGES |
108,172 |
114,307 |
119,200 |
|
SPECIAL
RATES |
6,505 |
6,784 |
7,076 |
|
USER
CHARGES AND FEES |
26,952 |
27,642 |
28,287 |
|
INTEREST |
4,415 |
4,415 |
4,415 |
|
OTHER
REVENUES |
9,427 |
9,699 |
10,721 |
|
GRANTS
– SERVICES |
13,060 |
13,834 |
14,622 |
|
CONTRIBUTIONS
& DONATIONS – SERVICES |
3,196 |
3,305 |
3,417 |
|
GRANTS
- MP PROJECTS - (Operating) |
980 |
980 |
980 |
|
CONTRIBUTIONS & DONATIONS - MP PROJECTS
(Operating) |
20 |
20 |
20 |
|
TOTAL OPERATING REVENUE |
172,727 |
180,987 |
188,739 |
|
GRANTS
- MP PROJECTS - (Capital) |
1,608 |
1,333 |
931 |
|
CAPITAL
CONTRIBUTIONS AND DONATIONS |
4,766 |
4,909 |
5,056 |
|
TOTAL CAPITAL REVENUE |
6,373 |
6,242 |
5.987 |
|
TOTAL REVENUE |
179,100 |
187,229 |
194,726 |
Operating Statement (Base + LRIS Borrowing Scenario) cont’d
|
Description
($000) |
2012/13 |
2013/14 |
2014/15 |
|
|
|
|
|
|
EXPENSES |
|
|
|
|
EMPLOYEE COSTS |
75,140 |
77,900 |
80,614 |
|
BORROWING COSTS |
4,580 |
5,235 |
5,257 |
|
MATERIALS & CONTRACTS |
30,687 |
31,340 |
32,244 |
|
OTHER OPERATING EXPENSES |
32,107 |
33,853 |
33,617 |
|
TOTAL SERVICES EXPENSES |
142,515 |
148,328 |
151,732 |
|
OPERATING PROJECTS |
3,459 |
3,013 |
2,911 |
|
DEPRECIATION |
28,532 |
29,976 |
33,064 |
|
TOTAL OPERATING EXPENSES |
174,505 |
181,318 |
187,706 |
|
|
|
|
|
|
NET OPERATING RESULT |
4,595 |
5,912 |
7,020 |
|
|
|
|
|
|
OPERATING RESULT BEFORE
CAPITAL REVENUE |
(1,778) |
(330) |
1,033 |
|
|
|
|
|
|
CAPITAL PROJECTS – EXPENDITURE |
61,115 |
45,626 |
33,127 |
|
CAPITAL PROJECTS FUNDING FROM
RESERVES |
61,115 |
45,626 |
33,127 |
|
NET CAPITAL PROJECTS RESULT |
0 |
0 |
0 |
Reconciliation of Net Operating Result to Services
Result (Base + LRIS Borrowing Scenario)
|
Description ($000) |
2012/13 |
2013/14 |
2014/15 |
|
SURPLUS/(DEFICIT)
FROM CONTINUING OPERATIONS |
4,595 |
5,912 |
7,020 |
|
PLUS
DEPRECIATION |
28,532 |
29,976 |
33,064 |
|
PLUS
OPERATING PROJECTS |
3,459 |
3,013 |
2,911 |
|
LESS
RESTRICTED REVENUE |
13,878 |
14,026 |
14,063 |
|
LESS LOAN
PRINCIPAL PAYMENTS |
17,105 |
6,602 |
7,105 |
|
LESS TRANSFER
TO RESERVE |
16,869 |
17,021 |
22,323 |
|
PLUS TRANSFER
FROM RESERVE TO FUND SERVICES |
20,304 |
8,621 |
11,816 |
|
SERVICES
RESULT |
9,038 |
9,873 |
11,320 |
BALANCE SHEET (Base + LIRS Borrowing
Scenario)
|
Balance
Sheet Description (in $000) |
2012/13 |
2013/14 |
2014/15 |
|
ASSETS |
|
|
|
|
Current
assets |
|
|
|
|
Cash and cash equivalents |
$6,000 |
$6,000 |
$6,000 |
|
Investments |
$60,581 |
$58,040 |
$71,754 |
|
Receivables |
$13,043 |
$13,043 |
$13,043 |
|
Inventories |
$141 |
$141 |
$141 |
|
Other |
$500 |
$500 |
$500 |
|
Non-current assets classified as held for
resale |
$0 |
$0 |
$0 |
|
Total
current assets |
$80,265 |
$77,724 |
$91,438 |
|
|
|
|
|
|
Non-current
assets |
|
|
|
|
Receivables |
$527 |
$527 |
$527 |
|
Investments |
$27,500 |
$27,500 |
$27,500 |
|
Infrastructure property, plant &
equipment |
$3,609,839 |
$3,622,698 |
$3,620,145 |
|
Intangible assets |
$4,288 |
$3,471 |
$2,655 |
|
Investments accounted for using equity
method |
$2,754 |
$2,754 |
$2,754 |
|
Total
non-current assets |
$3,644,908 |
$3,656,950 |
$3,653,581 |
|
|
|
|
|
|
Total
assets |
$3,725,173 |
$3,734,674 |
$3,745,019 |
|
|
|
|
|
|
LIABILITIES |
|
|
|
|
Current
liabilities |
|
|
|
|
Payables |
$14,500 |
$14,500 |
$14,500 |
|
Interest bearing liabilities |
$6,602 |
$7,105 |
$7,902 |
|
Provisions |
$21,121 |
$21,928 |
$22,767 |
|
Total
current liabilities |
$42,223 |
$43,533 |
$45,169 |
|
|
|
|
|
|
Non-current
liabilities |
|
|
|
|
Interest bearing liabilities |
$75,538 |
$77,778 |
$79,425 |
|
Provisions |
$1,003 |
$1,043 |
$1,084 |
|
Total
non-current liabilities |
$76,540 |
$78,820 |
$80,509 |
|
|
|
|
|
|
Total
liabilities |
$118,763 |
$122,353 |
$125,678 |
|
|
|
|
|
|
Net
assets |
$3,606,410 |
$3,612,320 |
$3,619,341 |
|
|
|
|
|
|
EQUITY |
|
|
|
|
Retained earnings |
$883,523 |
$889,433 |
$896,454 |
|
Reserves |
$2,722,887 |
$2,722,887 |
$2,722,887 |
|
Total
equity |
$3,606,410 |
$3,612,320 |
$3,619,341 |
CASH FLOW STATEMENT (Base +
LIRS Borrowing Scenario)
|
Budget Cash Flow Statement (in $'000) |
2012/13 |
2013/14 |
2014/15 |
|
Cash flows from operating activities |
|
|
|
|
Receipts: |
|
|
|
|
Rates and annual charges |
114,677 |
121,091 |
126,277 |
|
User charges and fees |
26,952 |
27,642 |
28,287 |
|
Investment revenue and interest |
4,415 |
4,415 |
4,415 |
|
Grants and contributions |
23,630 |
24,381 |
25,026 |
|
Other |
9,427 |
9,699 |
10,721 |
|
Payments: |
|
|
|
|
Employee benefits and on-costs |
(74,326) |
(77,053) |
(79,733) |
|
Materials and contracts |
(32,417) |
(32,847) |
(33,699) |
|
Borrowing costs |
(4,580) |
(5,235) |
(5,257) |
|
Other |
(33,837) |
(35,360) |
(35,073) |
|
Net cash provided (or used in) operating activities |
33,942 |
36,734 |
40,965 |
|
|
|
|
|
|
Cash flows from investing activities |
|
|
|
|
Receipts: |
|
|
|
|
|
0 |
2,541 |
0 |
|
|
43,000 |
1,745 |
1,530 |
|
|
1,824 |
1,863 |
1,902 |
|
Payments: |
|
|
|
|
Purchase of investments |
(20,541) |
0 |
(13,714) |
|
Purchase of real estate |
|
|
|
|
Purchase of infrastructure, property,
plant and equipment |
(61,115) |
(45,626) |
(33,127) |
|
Net cash provided by (or used in) investing activities |
(36,832) |
(39,477) |
(43,409) |
|
|
|
|
|
|
Cash flows from financing activities |
|
|
|
|
Receipts: |
|
|
|
|
Borrowings and advances |
19,995 |
9,345 |
9,549 |
|
Payments: |
|
|
|
|
Borrowings and advances |
(17,105) |
(6,602) |
(7,105) |
|
Net cash provided by (or used in) financing activities |
2,890 |
2,743 |
2,444 |
|
|
|
|
|
|
Net increase/(decrease) in cash and cash equivalents |
0 |
0 |
0 |
|
Cash and cash equivalents at beginning of reporting period |
6,000 |
6,000 |
6,000 |
|
Cash and cash equivalents at end of reporting period |
6,000 |
6,000 |
6,000 |
|
** Increase/Decrease |
0 |
0 |
0 |
RATES, FEES AND CHARGES
Ordinary and Special Rates Income
The Independent Pricing & Regulatory
Tribunal determines the maximum amount by which NSW Councils may increase their
general rate income above the general income for the previous year. For the
2012/13 financial year IPART has announced that the increase is 3.6%. IPART has
approved Council for a special variation to rates in 2012/13 of 0.7% in
addition to the rate pegging increase.
Land Valuation
In 2012/13 Council will be using land values
as at 1 July 2010 to calculate rates. Valuations are determined by the
NSW Government’s Valuer General.
Ordinary Rates
Rates are determined on the categorisation of
land. Council’s ordinary rating structure consists of two categories –
residential and business rates. These categories in turn have sub-categories
determined by the location of the land as detailed in the tables on the
following pages.
Special Rates
The Local Government Act provides that a council may make a special rate for or towards meeting the cost of any works, services, facilities or activities provided or undertaken, or proposed to be provided or undertaken, by the Council within the whole or any part of the Council’s area. In 2012/13 Council proposes to make a number of special rates and the details of these rates and the works and services that the special rates will fund are included in the following pages.
It is proposed that the use of the special
rates levied for Infrastructure include maintenance and/or operational phases
of approved special rate projects not just capital upfront expenditure, as part
of a prudent lifecycle approach to asset management.
Pensioner Rebates
All NSW councils give a mandatory rebate of up to $250 to
eligible pensioners. Parramatta City
Council is one of the few Councils that grants an additional voluntary rebate
of up to $100 to eligible pensioners. Funding of around $670,000 is required
for this additional voluntary rebate.
Council proposes to make the following Ordinary and Special Rates in
2012/13 following IPART’s approval for the special variation noted earlier.
Ordinary Rates
|
RATE |
# of Assessments |
Minimum
Rate ($) |
Ad
Valorem Rate in ($) |
Valuation (1
July 2010) |
Notional
Yield ($) |
|
Residential* |
32,230 |
|
.00264836 |
11,703,327,143 |
30,994,628 |
|
Residential* |
25,143 |
580.60 |
|
2,197,361,557 |
14,570,438 |
|
Subtotal |
57,373 |
|
|
|
45,565,066 |
|
Business
General |
1,170 |
|
0.01217397 |
501,187,919 |
6,101,446 |
|
Business
General |
178 |
591.90 |
|
5,976,137 |
105,359 |
|
Business
CBD |
1254 |
|
0.02162403 |
834,549,300 |
18,046,318 |
|
Business
CBD |
348 |
591.90 |
|
4,978,872 |
205,982 |
|
Business
CBD#2 |
9 |
|
0.03560188 |
76,196,000 |
2,712,721 |
|
Business
|
1222 |
|
0.01307191 |
1,238,838,016 |
16,193,978 |
|
Business
|
92 |
591.90 |
|
2,483,924 |
54,455 |
|
Business
|
1 |
|
0.01307191 |
53,000,000 |
692,811 |
|
Subtotal |
4,274 |
|
|
|
44,113,070 |
|
Total
Ordinary Rates |
61,647 |
|
|
|
89,678,135 |
Special Rates
|
PURPOSE |
# of Assessments |
Base
Amount ($) |
Ad
Valorem Rate in ($) |
Valuation (1
July 2010) |
Notional
Yield ($) |
|
61,531 |
|
0.00006253 |
16,617,898,868 |
1,039,090 |
|
|
Open Space Acquisition & Embellishment |
61,531 |
17.01 |
|
|
1,046,724 |
|
Infrastructure* |
59,928 |
|
0.00007793 |
15,701,703,696 |
1,250,177 |
|
Infrastructure* |
59,928 |
6.94 |
|
|
433,135 |
|
CBD Infrastructure |
1,611 |
|
.00209047 |
915,898,612 |
1,914,663 |
|
Economic Development |
2,595 |
|
.00038115 |
1,782,372,520 |
679,359 |
|
Total Special Rates |
|
|
|
|
6,363,148 |
|
Total
Ordinary and Special Rates |
96,041,283 |
|
less
Pensioner Rebates |
-2,627,894 |
|
less
Internal Rates Contra |
-489,640 |
|
Net
Total Ordinary and Special Rates |
92,923,749 |
* As per advice from the Division of Local Government, it was recommended that Council amend its Rating Structure due to the fact that the Residential CBD Rate had 97.6% of Ratepayers on the minimum Rate. “The overriding characteristic of local government rating is that the assessments are primarily and predominantly determined via the ad valorem method whereby the incidence of any rate burden is split differentially based on the value of rateable property.” As a consequence of this advice, Council has merged it Residential & Residential CBD Rate. This has also resulted in the CBD Residential Infrastructure Special Rate being obsolete and merged with the Suburban Infrastructure Special Rate. It has been renamed as “Infrastructure Special Rate”.
Special Rates 2012/13
The table below details the percentage of the total yield that the base
amount will produce for each of the following special rates:
|
Special
Rate |
Base
Amount Yield % |
|
Open
Space Acquisition and Embellishment |
50% |
|
Infrastructure |
25% |
Impact on average ratepayers
The following tables show the average impact on ratepayers and include
Special Rates, Waste Management Charges and the Stormwater Management Charge.
|
|
2011/12 |
2012/13 Rates |
|
|
($)
|
($) |
||
|
|
Combined
Rates |
Combined
Rates |
Increase
Per Qtr |
|
Average
Residential Property |
1,132.89 |
1,201.52 |
17.16 |
|
Average
Business General Property |
4,919.13 |
5,019.56 |
25.11 |
|
Average
Business CBD Property |
12,786.59 |
13,235.18 |
112.15 |
|
Average
Business CBD # 2 |
292,860.62 |
305,391.03 |
3,132.60 |
|
Average
Business |
12,346.67 |
13,043.34 |
174.17 |
|
Average
Business |
691,034.58 |
719,597.33 |
7,140.69 |
SPECIAL RATES INCOME AND
EXPENDITURE
The following tables show the estimated income and expenditure for each
of the special rates.
|
Name: Suburban Infrastructure Enhancement - Infrastructure |
Start Date: 2000/01 |
Finish Date: On going |
||
|
Purpose: To fund urban infrastructure (roads, kerb and gutter, improvement to town centres and waterways) |
||||
|
Rating Base: All rateable properties outside the Central Business District |
||||
|
Income and Expenditure
($000) |
||||
|
Estimated Balance (01/07/2012)
|
Estimated Income (inc. Interest) |
Estimated Expenditure |
Estimated Balance (30/06/2013) |
|
|
102 |
592 |
658 |
36 |
|
|
Projects to be funded from
Special Rates |
||||
|
Type of Works |
Description |
Budget ($,000) |
||
|
Fair Value of Assets |
Legislative requirement for Asset Revaluation of Buildings, Land, Plant & Equipment, Office Furniture & Other Structures. |
140 |
||
|
Civil Construction Program |
Footpath and Kerb & Gutter construction at various streets in the LGA |
370 |
||
|
Flood Mitigation |
Rehabilitation of various creeks in the LGA to safely accommodate flood waters and convey it to downstream rivers without causing damages. |
148 |
||
|
Total |
658 |
|||
|
Name: Suburban Infrastructure Enhancement - Environment |
Start Date: 2000/01 |
Finish Date: On going |
|||
|
Purpose: To fund urban infrastructure (roads, kerb and gutter, improvement to town centres and waterways) |
|||||
|
Rating Base: All rateable properties outside the Central Business District |
|||||
|
Income and Expenditure
($,000) |
|||||
|
Estimated Balance (01/07/2012)
|
Estimated Income (inc. Interest) |
Estimated Expenditure |
Estimated Balance (30/06/2013) |
||
|
563 |
823 |
888 |
498 |
||
|
Projects to be funded from
Special Rates |
|||||
|
Type of Works |
Description |
Budget ($,000) |
|||
|
Creek and foreshore stabilisation works at eight locations identified in the Council adopted Environmental Improvement Program |
320 |
||||
|
Fishladder Construction |
Construction
of the final (fourth) fishway opposite the |
300 |
|||
|
Waterways Litter Reduction |
Litter removal from waterways and adjoining creek banks following rain events |
53 |
|||
|
Wildlife Surveys |
Wildlife surveys of core Bushland areas to establish baseline data on fauna diversity |
50 |
|||
|
Sustainable Water Program |
Stormwater reuse project Doyle Ground Parramatta and soil improvement study at 2 sportsgrounds to minimise irrigation requirements |
50 |
|||
|
Waterways Rehabilitation Masterplan |
Preparation
of the |
50 |
|||
|
|
Finalisation of the Parramatta River Estuary Study and Plan on behalf of 7 foreshore councils |
50 |
|||
|
Catchment Modelling – flood studies |
Contribution towards flood study modelling in accordance with adopted plan |
15 |
|||
|
Total |
888 |
||||
|
Name: Suburban Infrastructure Enhancement - Neighbourhood |
Start Date: 2000/01 |
Finish Date: On going |
||
|
Purpose: To fund urban infrastructure (roads, kerb and gutter, improvement to town centres and waterways) |
||||
|
Rating Base: All rateable properties outside the Central Business District |
||||
|
Income and Expenditure
($000) |
||||
|
Estimated Balance (01/07/2012)
|
Estimated Income (inc.
Interest) |
Estimated Expenditure |
Estimated Balance (30/06/2013) |
|
|
358 |
332 |
195 |
495 |
|
|
Projects to be funded from
Special Rates |
||||
|
Type of Works |
Description |
Budget ($000) |
||
|
CAP Neighbourhood Improvement Program |
Ongoing upgrades to Streetscape and infrastructure across the city. This includes upgrades to footpaths, laneways and the foreshore. |
195 |
||
|
Total |
195 |
|||
|
Name: Economic Development |
Start Date: 2000/01 |
Finish Date: N/A
|
|
|
Purpose: To support the
achievement of Regional Economic Plan targets for employment in the |
|||
|
Rating Base: All rateable
properties in the |
|||
|
Income and Expenditure
($000) |
|||
|
Estimated Balance (01/07/2012)
|
Estimated Income (inc.
Interest) |
Estimated Expenditure |
Estimated Balance (30/06/2013) |
|
259 |
692 |
699 |
252 |
|
Projects to be funded from
Special Rates |
|||
|
Type of Works |
Description |
Budget ($000) |
|
|
Economic Development |
The economic development project’s goals are to help |
639 |
|
|
Rydalmere Technology Precinct |
The Rydalmere project includes Studies to enable the
possible transition of the |
60 |
|
|
Total |
699 |
||

|
Name: Open Space Acquisition & Embellishment |
Start Date: N/A |
Finish Date: N/A |
|
|
Purpose: To fund acquisition of open space and embellishment of Parks and Public Domain |
|||
|
Rating Base: All rateable
properties in the |
|||
|
Income and Expenditure ($000) |
|||
|
Estimated Balance (01/07/2012) |
Estimated Income (inc. Interest) |
Estimated Expenditure |
Estimated Balance (30/06/2013) |
|
786 |
2,248 |
2,561 |
473 |
|
Projects to be funded from Special Rates |
|||
|
Type of Works |
Description |
Budget ($000) |
|
|
Bushland restoration & regeneration works to 5 core areas of the bushland reserves to reduce the extent of noxious weeds & enable improved public access to the bushland sites |
550 |
||
|
Pavilion Program |
Replacement &/or upgrading of sporting pavilions & amenities buildings within parks |
500 |
|
|
Walking Track Construction |
Provision of bush walking tracks within the public open space & natural areas |
110 |
|
|
Parks Program |
Minor park improvements including fencing; paths; seating; picnic shelters; landscaping plus matching funding for grant funded projects by NSW Sport & Recreation |
70 |
|
|
Sportsground Program |
Improvements to sporting fields including rebuilding, drainage, irrigation, fencing & floodlighting |
400 |
|
|
Cultural Parks Program |
Restoration of headstones & monuments at the 3 heritage cemeteries & historic memorials & monuments within parks. |
85 |
|
|
Bushland Resources Mgt |
Bushland restoration & regeneration works to 5 core areas of the bushland reserves to reduce the extent of noxious weeds & enable improved public access to the bushland sites |
433 |
|
|
Asbestos Removal |
Removal & or related control measures to manage asbestos materials regularly illegally dumped within bushland reserves |
53 |
|
|
Playground Replacement |
Replacement of 4-5 children’s’ playgrounds per annum within parks & reserves. This ensures the equipment installed is modern, well used & complies with relevant safety standards |
30 |
|
|
Protection of Aboriginal Heritage |
Management & protection of known aboriginal heritage sites within the parks, waterways & other public natural areas. This includes identification, interpretative signage, monitoring, protective fencing & investigations. |
25 |
|
|
Environmental Education |
Resource funding for various annual environmental education displays, programs & projects including Australia Day, World Environment Day, National Tree Day, assistance to schools. Funding for Spring Garden Competition promotion & advertising. |
20 |
|
|
City
of |
Annual
tree planting program to provide additional street & parks trees to green
the city & enhance neighbourhood streetscapes. Provision of shade trees around park
playgrounds & sporting fields. |
85 |
|
|
Contaminated Lands - Investigation |
Investigate identified parks & reserves with contamination history to determine the type and extent of contamination |
200 |
|
|
Total |
2,561 |
||
|
Name: CBD Infrastructure Enhancement
|
Start Date: 2000/01 |
Finish Date: N/A |
||
|
Purpose: To support the improvement of the Infrastructure in the CBD |
||||
|
Rating Base: Land categorised as Business CBD and Business Centre of Activity # 2 |
||||
|
Income and Expenditure ($000) |
||||
|
Estimated Balance (01/07/2012) |
Estimated Income (inc. Interest) |
Estimated Expenditure |
Estimated Balance (30/06/2013) |
|
|
4,510 |
2,223 |
2,021 |
4,712 |
|
|
Projects to be funded from Special Rates |
||||
|
Type of Works |
Description |
Budget ($000) |
||
|
City Centre Streetscape |
Ongoing upgrades to Streetscape and infrastructure across the city. This includes upgrades to footpaths, laneways and the foreshore. |
1,721 |
||
|
Foreshore Improvement |
This project is part of the revitalisation of the Parramatta River Foreshore and involves the construction of a children’s playground on the northern riverbank. |
120 |
||
|
|
Upgrade of |
150 |
||
|
Place Activation |
Pilot study on innovative activation programs in urban centres to economically and socially enliven centres. These programs will assistance local business and deliver innovative events for local neighbourhood centres throughout the LGA. |
30 |
||
|
Total |
|
2,021 |
||

|
Name: Parking Meters Revenue, Expense and Usage |
|||
|
Income and Expenditure
($000) |
|||
|
Estimated Balance (01/07/2012)
|
Estimated Income |
Estimated Expenditure |
Estimated Balance (30/06/2013) |
|
3,497 |
Gross Income 4,696 |
5,838 |
1,142 |
|
Operational Expenditure* 1,213 |
|||
|
Net 3,483 |
|||
|
*Excludes
depreciation |
|||
|
Services and Projects to be
funded from Parking Meter Revenue |
|||
|
Type of Works |
Description |
Budget ($000) |
|
|
Purchase and deployment of wireless mobile digital CCTV cameras for crime prevention, enforcement, detection and public safety. |
100 |
||
|
Paid Parking Plan |
Purchasing and installation of new parking meters and associated management system |
3,200 |
|
|
Footpath and Access |
Pedestrian Access and Mobility Program |
1,200 |
|
|
Major Events |
Major Events Program |
470 |
|
|
Major Events |
Parramasala - Contribution for Australian Festival of South Asian Culture to supplement funding from Events NSW |
300 |
|
|
Arts Services |
Artist Studios Projects |
227 |
|
|
Urban Designers |
Improving Urban Design |
341 |
|
|
Total |
5,838 |
||
Annual
Charges—Stormwater Management Charge
In
accordance with the Local Government Amendment (Stormwater) Act 2005,
Parramatta City Council introduced a Stormwater Management Charge in the
2006/07 year. The Stormwater Management Charge is levied on all parcels of
rateable urban land within the City of Parramatta categorised for rating
purposes as Residential or Business
(including all sub categories), not being vacant land or land owned by the
Crown, or land held under lease for private purposes under the Housing Act 2001
or the Aboriginal Housing Act 1998.
Council
administers a comprehensive waterways management program that is underpinned by
its long-term strategic plan, Rivers of Opportunity, available for download
from -
www.parracity.nsw.gov.au/home/publications/list_of_publications
A database of prioritised waterways
activities required to fulfil the plan is being implemented as available funds
allow. As the principal authority
responsible for the management of stormwater, Council:
· maintains 438 km of stormwater discharge
drainage pipes for stormwater conveyance.
· implements essential flood mitigation measures to protect life, property
and infrastructure.
· conserves the natural waterways of the City.
· protects bushland and other natural assets
from the impacts of urban runoff by implementing purpose-built pollution
control traps and water retention systems.
The
maintenance and operational costs associated with stormwater infrastructure
throughout the City of
|
Name: Stormwater Revenue, Expense and Usage |
|||
|
Services and Projects to be
funded from Stormwater Revenue |
|||
|
Estimated Balance (01/07/2012)
|
Estimated Income |
Estimated Expenditure |
Estimated Balance (30/06/2013) |
|
391 |
1,382 |
1,370 |
403 |
|
Service/Project |
Description |
Source of Funds |
Budget, ($000) |
|
Riparian Maintenance |
Protection of the City's natural waterways from the impacts of urban runoff such as weeds and litter |
SL |
450 |
|
Stream Health and Waterways Monitoring |
Monitoring of the waterways to determine the effectiveness of the implemented measures |
SL |
120 |
|
Pollutant Trap Cleaning |
Ongoing maintenance of pollution control devices to protect the City's waterways |
SL |
150 |
|
Stormwater Reuse Parks |
Provision of stormwater harvesting and reuse facilities in parks and reserves |
SL |
130 |
|
Drainage Maintenance |
Upgrading the existing stormwater system to maximise efficient conveyance of runoff for the protection of life and property |
SL |
520 |
|
|
|
TOTAL |
1,370 |
|
|
SR Special Rate GR General Revenue G Grants L Loans D Developer Contrib. SL
Stormwater Levy |
|
|

|
Stormwater
Services & Projects funded from sources other than the Annual Charge |
|||
|
Service / Project |
Description (In $’000) |
Source of Funds |
Budget |
|
Sustainable Water Program |
Water conservation and reuse measures in accordance
with adopted 4 year Waterways Environmental Improvement program |
SR |
50 |
|
Water Quality Improvement |
Capital works projects to improve water quality eg.
Pollutant treatment assets |
L |
300 |
|
Water ways Rehabilitation Master planning |
Sub-catchment master planning to address degraded
riparian and estuarine corridors |
SR |
50 |
|
Floodplain Risk Mgmt Planning |
Whole of catchment planning to address floodplain
risk and prioritised flood mitigation measures |
GR,G |
120 |
|
Flood Mitigation Program |
Capital works projects to address flood mitigation
and to minimise flood damage / risk |
GR, SR |
360 |
|
Catchment Modelling Program |
Catchment based modelling for flood mitigation,
drainage alleviation and water quality improvement |
GR, SR |
100 |
|
Drainage Construction Program |
Capital works projects to improve local drainage
systems and hence stormwater flooding problems |
GR |
520 |
|
Waterways Restoration |
Restoration of natural waterways in terms of bank
stabilisation, weed control, native planting and channel improvement works |
SR |
320 |
|
Waterways Litter Reduction |
Removal of litter from priority waterways after rain
events |
SR |
53 |
|
Drainage Improvements to Future RDS Areas |
Areas flagged for increased residential development
will have existing drainage assets upgraded and amplified to meet increased
stormwater run off demands |
D |
60 |
|
|
SR- Special
Rate; GR - General Revenue; G - Grants; L - Loans; D
- Developer Contribution; SL - Stormwater Levy |
TOTAL |
1,933 |
 Annual Charges—Stormwater Management Charge
|
Annual Charge Per
Assessment |
|
|
All parcels of rateable urban land categorised as
Residential or Residential CBD excluding Strata properties |
$25.00 |
|
All strata properties categorised as Residential or
Residential CBD |
$12.50 |
|
Estimated Yield |
$1,071,213 |
|
|
|
|
|
|
|
Business Properties |
Annual Charge Per Assessment |
|
Per 350sq metres or part thereof capped at $200 |
|
|
All parcels of rateable urban land categorised as
Business (all sub categories) including Business Strata properties |
$25.00 |
|
Estimated Yield |
$ 194,349 |
|
|
|
|
Total Estimated Yield |
$1,265,562 |
Domestic Waste Management Charges
Domestic Waste Management
services are provided on a full cost recovery basis. Costs are determined by
contractor charges for collection, management and treatment of waste, and the
costs for education and environmental awareness programs and associated Council
overheads necessary to manage the service. In 2012/13 the charges will increase
by 10%. The increased charge reflects an ongoing improvement in Council’s
approach to waste management and resource recovery.
Domestic Waste Management Availability Charge
Section 496 of the Local Government Act, 1993
specifies that councils must make and levy an annual charge for the provision
of Domestic Waste Management services for each parcel of rateable land for
which the service is available. The charge levied is proportionate to the
administrative costs of providing the service.
Commercial Waste Management
Charges
Section 501 of the Local
Government Act 1993 provides that a council may make an annual charge for
Commercial Waste Management Services. The annual charge may be levied on each
parcel of rateable land for which the service is provided or proposed to be
provided. The council may make the charge for the service according to the
actual use of the service. Commercial Waste Management services are provided on
a full cost recovery basis. Costs are
determined by contractor charges, disposal costs and associated Council
overheads necessary to manage the service. Commercial charges apply to
individual enterprises which have opted to use Council’s service.
Annual Charges—Waste Management Services
Annual
Charge for the provision of Waste Management Services under Section 501 and
Section 496 of Local Government Act 1993 to be levied are as follows:
|
Service
Level |
Service
Mix |
Pickup
Frequency |
Fees
|
Annual
Charge per Property |
Yield
|
|
|
Domestic |
|
|
|
|
|
|
|
Basic
Service |
Domestic Waste
Collection |
1per
week |
140
Ltr $319.99 |
240
Ltr $482.31 |
|
$18,427,047.11 |
|
|
Collection of
Recyclables |
1per
fortnight |
Included |
Included |
|
|
|
|
Collection of
garden waste |
1per
fortnight |
Included |
Included |
|
|
|
Additional
Services |
Per
bin |
1per
week |
140
Ltr $319.99 |
240
Ltr $482.31 |
|
|
|
|
Recycling |
1per
fortnight |
|
|
240
Ltr $92.95 |
$22,493 |
|
|
Garden
Waste |
1per
fortnight |
|
|
240
Ltr $92.95 |
$14,872 |
|
Unoccupied
Land |
Availability
|
Not
applicable |
|
|
$55.20 |
$41,565 |
|
|
|
|
|
|
TOTAL |
$18,505,977 |
|
Commercial |
|
|
|
|
|
|
|
Basic
Service |
Commercial Waste
Collection |
1
per week |
140
Ltr $327.77 |
240
Ltr $493.91 |
|
$1,273,957 |
|
Additional
Services |
Per
Bin Collection Waste |
1
per week |
140
Ltr $327.77 |
240
Ltr $493.91 |
|
|
|
|
Recycling
(new) |
1per
fortnight |
|
|
240
Ltr $97.24 |
$21,198 |
|
|
Garden
waste (new) |
1per
fortnight |
|
|
240
Ltr $97.24 |
$6320 |
|
This
statement does not include the impact of rebates given by Council and
therefore differs from the financial statements |
|
|
|
|
TOTAL |
$1,301,475 |
|
Excludes
GST |
|
|
TOTAL
DOMESTIC & COMMERCIAL WASTE |
$19,807,452 |
||
Section 611 Charges
Section 611 of the Local Government Act 1993
provides that Council may make charges on persons for the time being in
possession, occupation or enjoyment of a rail, pipe, wire, pole, cable, tunnel
or structure laid, erected, suspended, constructed or placed on, under or over
a public place.
Where applicable, such charges will be made
in 2012/13 and will be based on the nature and extent of the benefit enjoyed by
the person concerned.